Pearl
Pearl Bitway
 NEAR Protocol
 Sui
Sui Pudgy Penguins
 Starknet
 Pons
Pons

Key Insights:
- BTC forms bullish engulfing pattern with 78% historical breakout success rate.
- Miner selling, funding rates drop spark short-term caution below $110K.
- Liquidity rebound mirrors 2022 bottom, hints at potential BTC surge.
Bitcoin flashes an 18% breakout signal from an engulfing pattern, but cautious futures data and miner selling raise doubts. Liquidity trends suggest upside remains firmly in play.
Bitcoin rebounds above $107K, charts 18% breakout signal
BTC traded at $107,474 on Friday after recovering from a brief dip below $100,000 earlier in the week. The price drop followed reports that Iran launched strikes on U.S. military bases in Qatar, briefly triggering panic across risk markets.
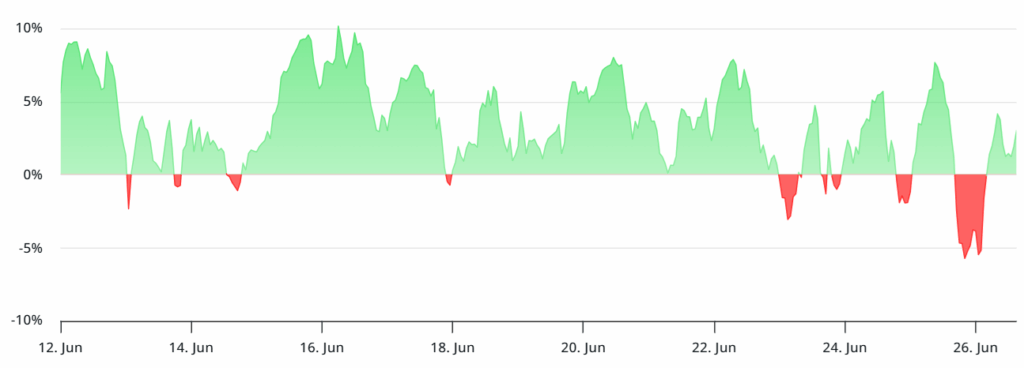
Despite recovering above $108,000, sentiment in Bitcoin futures markets has turned defensive. On-chain data from Laevitas shows the funding rate for perpetual contracts flipped negative its lowest point in seven weeks even as BTC rose. That shift highlights lower confidence among leveraged traders.
The bearish sentiment shift emerged amid rising geopolitical tensions and domestic trade policy uncertainty. According to the Washington Post, President Donald Trump’s administration has enacted over 50 tariff policy reversals since taking office. The eurozone agreement expires July 9, fueling concerns about another round of escalations.
Bullish engulfing pattern meets key breakout criteria
Technically, Bitcoin is flashing an 18% upside target from a confirmed bullish engulfing pattern on the daily chart. According to pattern data since January 2021, 15 out of 19 confirmed engulfing setups led to higher local highs, translating to a 78% historical success rate.
Only two signals failed in the past 24 months in May 2024 and March 2025 both within volatile market phases. The current setup aligns with prior successful patterns, suggesting BTC could rally toward the $130,000–$132,000 region, based on Fibonacci projections.
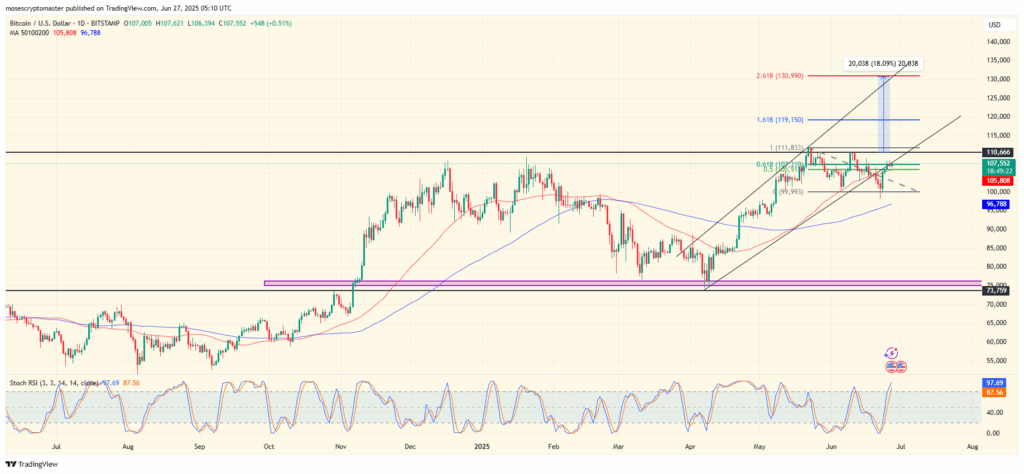
Chart data from TradingView shows BTC reclaiming the 0.618 Fibonacci level at $106,370. The next key level is $111,833, with breakout targets extending to $119,150 and $130,990, based on 1.618 and 2.618 extensions respectively.
However, caution remains visible in momentum indicators. Stochastic RSI sits above 87, flashing overbought conditions. A consolidation or retest of $100,000 remains possible if bulls fail to breach $111,000 resistance.
Miners pivot to ETH as profits dip
Nasdaq-listed Bit Digital (BTBT) said it plans to exit Bitcoin mining and shift to Ethereum. The firm held 417.6 BTC and 24,434 ETH as of March 31. It blamed falling mining profitability for the pivot, adding to concerns that other firms may liquidate BTC holdings.
CryptoQuant data confirms mining revenue has fallen to a two-month low. This adds selling pressure at a time when futures traders are already retreating.
“Miners capitulating and shifting to ETH shows internal BTC fragility,” one analyst wrote on X, citing the move as a red flag if adopted widely.
Liquidity backdrop echoes pre-2023 rally
Despite short-term fear, liquidity conditions suggest a supportive macro backdrop for BTC.
According to Swissblock, internal liquidity levels on the Bitcoin network have returned to late 2022 levels. That period preceded a near-doubling of price from $16,800 in three months. BTC’s realized cap has hit a new high at $944 billion, reflecting strong capital inflows.
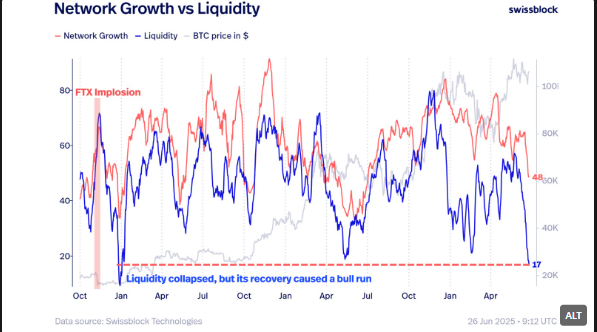
Since Nov. 2022, Bitcoin has absorbed over $544 billion in new liquidity, marking its most aggressive cycle inflow on record. Liquidity cycles have historically preceded price rallies, positioning Bitcoin for a continuation toward new highs.
Glassnode data also shows BTC remains range-bound between $100,000–$110,000. Spot volume and profit-taking have slowed, but long-term trend strength remains intact.
“The liquidity setup is bullish not seen since the 2022 bottom,” Swissblock wrote.
Sentiment split as traders eye July catalysts
Broader sentiment remains mixed. While retail traders expect a breakout, institutional caution is rising. The Russell 2000 index hit a four-month high, while BTC lagged behind. Some analysts attributed the divergence to concerns around artificial intelligence valuations and tightening liquidity.
Gartner analysts recently called most agentic AI projects “hype-driven proofs of concept,” adding to the uneasy market tone. Profit-taking near $105,000 has intensified as traders hedge exposure ahead of July’s macro events.
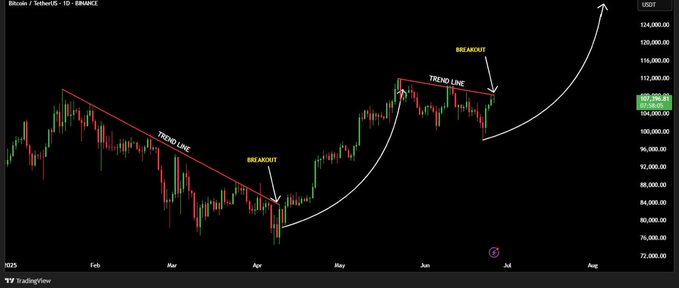
Henry (@LordOfAlts) wrote, “We always see a pump after consolidation, but profit booking is a must.”
With July 9 approaching, eyes remain on the eurozone tariff deadline and whether U.S. trade talks collapse. Until then, Bitcoin’s technicals favor upside but the path to $130,000 will likely remain contested.
Disclaimer
This article is for informational purposes only and provides no financial, investment, or other advice. The author or any people mentioned in this article are not responsible for any financial loss that may occur from investing in or trading. Please do your research before making any financial decisions.