
 astronaut
 Zylo Ecosystem
 Pearl
Pearl Bitcoin
 Quantus
 Pudgy Penguins
 Bitway

Key Insights:
- Cardano gains 5.14%, while Grayscale ranks it in the top nine.
- ADA on-chain transactions surge 10.7%, boosting short-term market sentiment.
- Resistance at $0.58 remains crucial for sustained price reversal.
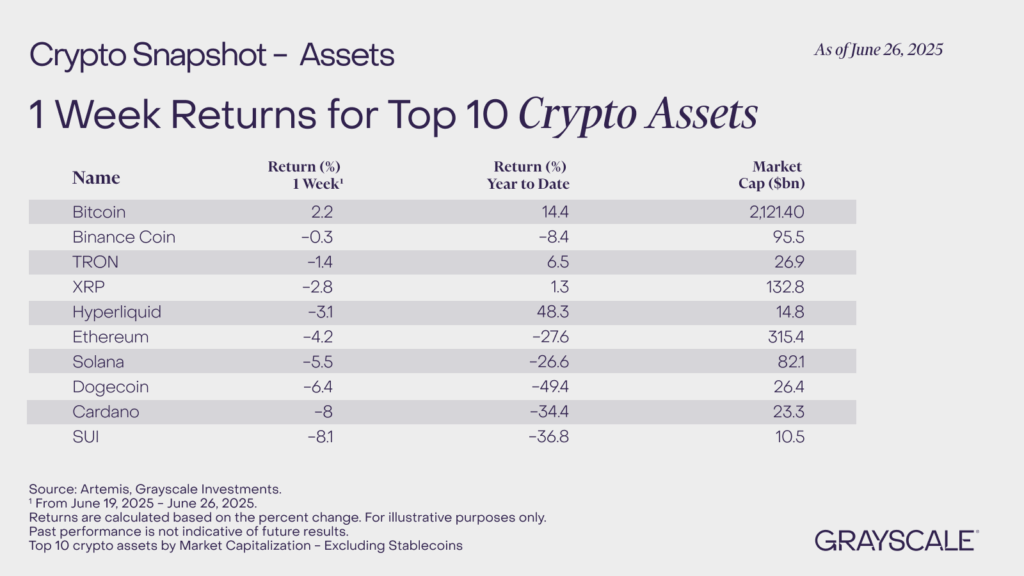
Cardano (ADA) has indicated a temporary period of recovery, as the coin gained 5.14% in the last week. However, the previous seven-day period resulted in an 8% drop in value. As per the recent release of Grayscale Investments on June 26, Cardano was ranked in the ninth position in the returns of the most popular crypto assets of the week.
Cardano Weekly Performance in Context
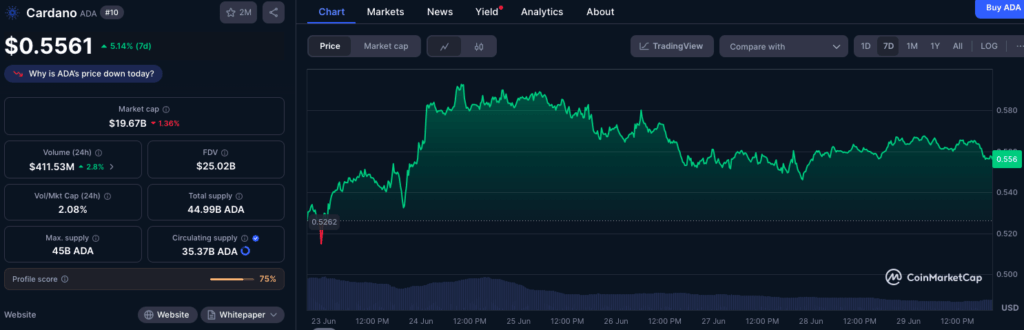
According to Grayscale, which recently filed an XRP ETF, ADA is one of the gainers and decliners in the top 10 list. The weekly price difference of 2.2% indicated that Bitcoin was the leader when compared to ADA at 8%. Initially, it was observed that ADA was not posted as a show among the performers, but this week, it has registered some gains. As it stands today, with a market cap of circa $19.67 billion and a 24-hour volume of just over 411.53 million (up by 2.8%), ADA has shown a marginal rise in activity after its month-long decline.
The year-to-date performance is also negative at -34.4%, which underscores what has been discussed above. ADA’s recent moves are a local pullback to a larger bearish pattern. Nevertheless, the recent price surge has put Cardano under the radar despite being at critical support. This is especially since the digital coin was reported in the Grayscale asset tracker under the weekly returns momentum.
There is also a narrative of a price rebound in Cardano on-chain metrics. As noted by Artemis dashboard data, the daily volume of transactions on the network increased by 10.7% to 19.9K as of June 29. In the week’s transaction chart, one can point out the significant rebound after the mid-month period in June. During this, the volumes were reduced to below 10K interactions in a day. The latest tally has fallen back in the range of late-May averages, and this is an indication of a return to utility or tests on the protocol.
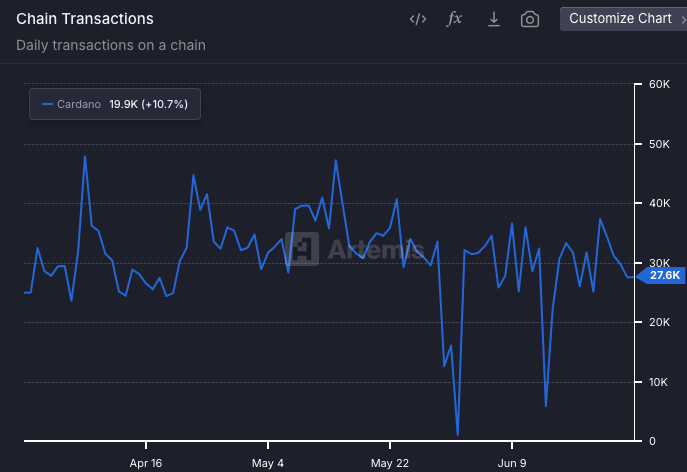
This activity boost at the chain level is most of the time correlated with the number of users involved in the chain or DApp activity, which plays a vital role in sustaining the demand for a token. Although this does not always correspond with the bullish continuation, the 10.7% increase puts things into perspective on why Cardano could be undergoing a local upward trend in terms of market price and visibility.
ADA Attempts Reversal From Multi-Month Downtrend
ADA/USDT charts on the daily scale indicate that since the beginning of May 2025, Cardano has been moving in the descending parallel channel. This pattern formation has experienced descending highs and descending lows. It recently hit support at $0.50 and $0.52. The blue band of support is horizontal in this zone, which has long played the role of a demand cluster in history. This is where price responses have been projected on a short-term basis.
On June 2527, ADA, predicted to reach $1 soon, rebounded off this critical support and tried to breach the downward-trending channel. The breakout is not confirmed yet. However, the price action has moved to test the top of the bearish structure. It would take a close above $0.58 and confirmed volume to confirm a breakout attempt and change the direction to buyers.
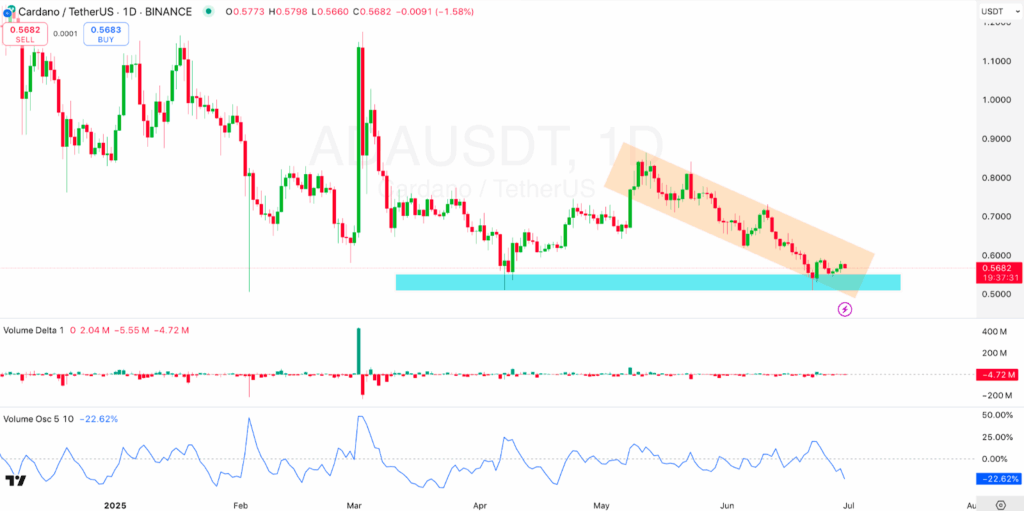
Volume analysis is still bad. The daily deficit of -4.72M tokens shows that the net selling pressure is higher than the buying pressure. Also, the volume oscillator is off by 22.62%, which is indicative of an overall reduction in trading volume. This could indicate that sustained volume inflows did not support the recovery unless some additional drivers are implemented.
According to the data on CoinMarketCap’s dashboard, the maximum supply of Cardano is 45 billion coins, while the circulating supply is 35.37 billion. It is valued at the fully diluted valuation (FDV) of $25.02 billion. The 24-hour volume to market cap ratio is 2.08%, which is considered average and means that there is healthy (not speculative) trading. If this ratio rises toward 3%—4% as prices remain the same or increase, short-term traders are becoming more convinced.
Disclaimer
This article is for informational purposes only and provides no financial, investment, or other advice. The author or any people mentioned in this article are not responsible for any financial loss that may occur from investing in or trading. Please do your research before making any financial decisions.




