astronaut
 Pearl
Pearl Zylo Ecosystem
 Bitcoin
 Bitway
 NEAR Protocol
 Zcash
Zcash

Key Insights:
- Gold price defended $3,180 support as traders eye $3,295–$3,300 for potential rejection.
- Weekly Gravestone doji warns that a bullish long-term breakout is still possible.
- Cup-and-handle pattern is still aiming at the mark of $3,800-4,000, provided that $3,300 is broken shortly.
Gold price is hovering near a critical support zone as technical analysts weigh diverging possibilities for a near-term rebound or deeper retracement. The metal now trades near $3,282, having corrected against monthly highs, but sentiment remains divided between bearish resistance levels in the short term and bullish targets in the long term.
Gold Price Finds Support Around $3,180
Gold price recently retested the $3,180 support area, a level flagged by analyst Ali as a potential pivot for a rebound. In a TradingView chart shared on June 30, Ali noted, “Gold may find support around $3,180. This is a key level to watch for a potential rebound.” The zone coincided with the past area of consolidation and may indicate the start of a technical rebound.
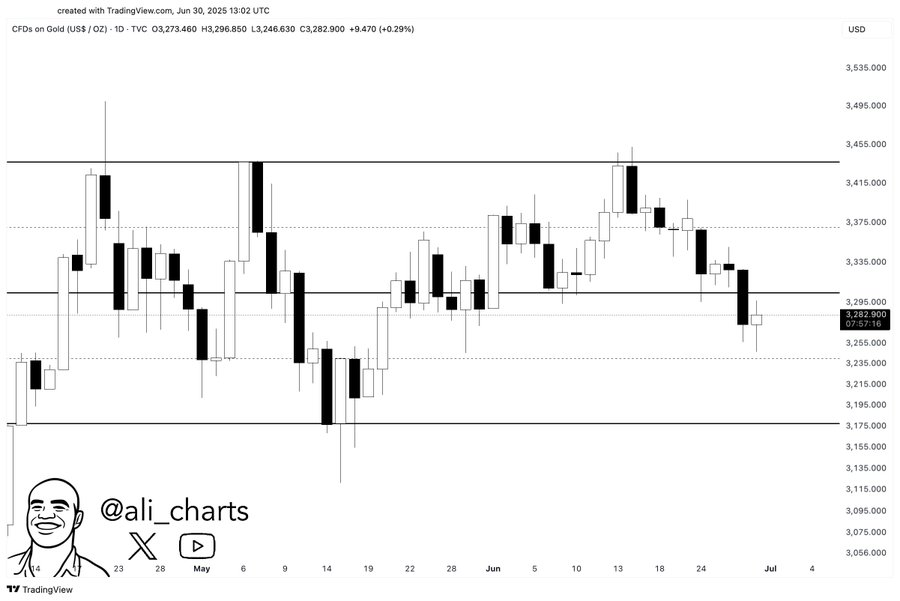
The daily chart indicated that there had been other price action around this level, with buyers willing to act. After briefly dipping below $3,200, gold price recovered modestly, closing above $3,280 with a +0.29% gain. According to the pattern, consolidation between $3,180 and $3,295 may take place unless another breakout can be obtained. The RSI is also close to neutral at the daily, and the following may either see a bounce off or an additional breakdown.
Nevertheless, the price continues to remain suppressed within the resistance area of $3,300 even after the rebound attempt. This supports the trend conflict between bulls protecting a firm support and the pressure being exerted by sellers around local highs.
Range-Bound Setup Persists Below $3,300 Resistance
Meanwhile, analyst Allie cautioned that gold price remains trapped in a range between $3,250 and $3,330. “As long as gold does not effectively break through $3300, the range will still be 3250–3330,” Allie wrote. She advised short plays at $3,290 and $3,295, assuming that the upward momentum does not hold up beyond $3,300.
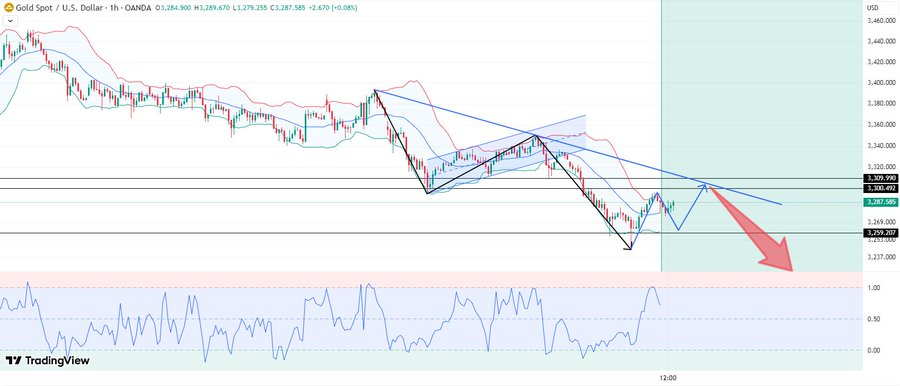
Her chart showed gold price trading below a descending trendline with repeated rejections around $3,295. The 1H RSI is leaning bearish, and the price action is indicating a breakdown of a bearish flag. This is a highly technical arrangement that prefers selling rallies until the market efficiently breaks the $3300 price level.
Notably, the strategy of Allie focuses on short-term scalping in a range structure, in terms of which the price is still fading in resistance and buyers appear in support. The downside continuation projection suggests the price would go down to around $3,150- $3,160 should the upward momentum break at $3,180.
Gravestone Doji Emerge Amid Long-Term Bullish Setup
While near-term price action remains indecisive, Boj Paulus highlighted a more structural chart development that could shape gold macro trend. A gravestone doji candlestick started to form in the Weekly chart on his chart at the top of a parabolic cup-and-handle breakout. The pattern is a sign of a warning of fatigue, which is usually related to short-term tops.
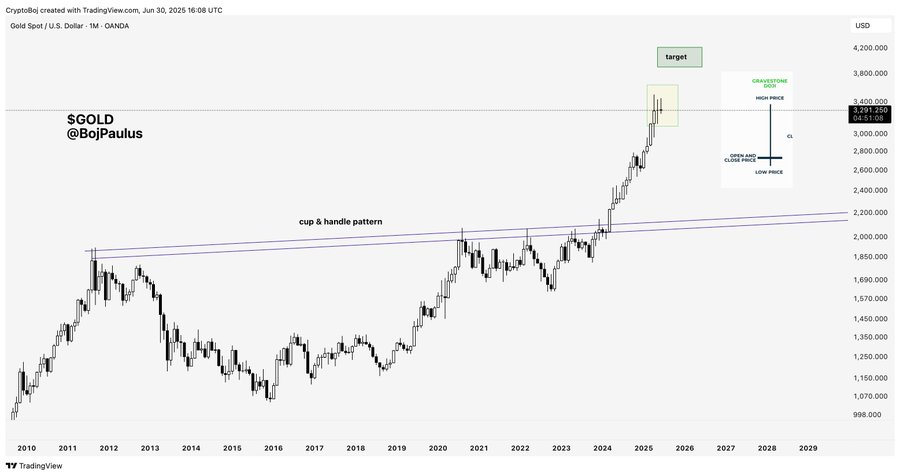
Paulus added, “The gravestone doji is one of the most valid candle formations to use in calling tops.” Nevertheless, he still believed that the long-term structure is bullish, and the cup-and-handle pattern continues to signal targets in the range of $3,800 to $4,000.
In the accompanying chart, gold has already broken out of the multi-year handle, pushing into the $3,100–$3,300 zone. The neckline retest around $3,100 may give a bullish continuation. The doji presence, however, is an indication that this rally might be facing short-term resistance because market players will reassess risk and momentum.
Gold Technicals Split Between Correction and Continuation
Meanwhile, the conflicting indicators in various time frames showed a typical contrast between the short-term accumulation and long-term power. Lower-timeframes have welcomed range-trading strategies and bearish opportunities when the market failed to overcome $3,300. The next area of resistance is at $3,295-3,300, and this is firm, with momentum running out at trendline resistance.
However, the wider weekly and monthly charts have bullish frameworks. The cup-and-handle formation is completing, and the magnitude of the previous breakout favors a long play upswing. Gold’s ability to maintain higher lows, even during pullbacks, suggests that structural bulls may accumulate again near $3,180 or lower.
Disclaimer
This article is for informational purposes only and provides no financial, investment, or other advice. The author or any people mentioned in this article are not responsible for any financial loss that may occur from investing in or trading. Please do your research before making any financial decisions.