
 astronaut
 Pearl
Pearl Zylo Ecosystem
 Bitcoin
 Bitway
 NEAR Protocol
 Zcash
Zcash

Key Insights:
- Gold price reclaimed a 6-month rising trendline after bouncing above the $3,310 level.
- The breakout above the falling channel near $3,350 signals bullish continuation.
- Fibonacci 0.618 bounce and rising RSI suggest a move toward $3,880–$3,900 next.
Gold price regained strength after reclaiming its 6-month rising trendline. According to analysts, the asset returned to trade above the $3,350 level following a correction, and this has reclaimed bullish sentiment. Technical signals indicated a new rally to $3,900, as support was observed at around $3,310, and the momentum had also gained traction.
Breakout Spark Recovery in Gold Price
Gold price reclaimed a key 6-month ascending trendline, according to Rashad Hajiyev’s analysis. After initially breaking below, Gold price returned above the line and began consolidating above $3,350.
The analyst highlighted that a retest of this trendline near $3,310 could precede a sharp rebound. Moreover, the current structure suggests that if buyers defend this region, a rally toward $3,450 may soon follow. This would align with previous rallies that bounced off the same trendline.
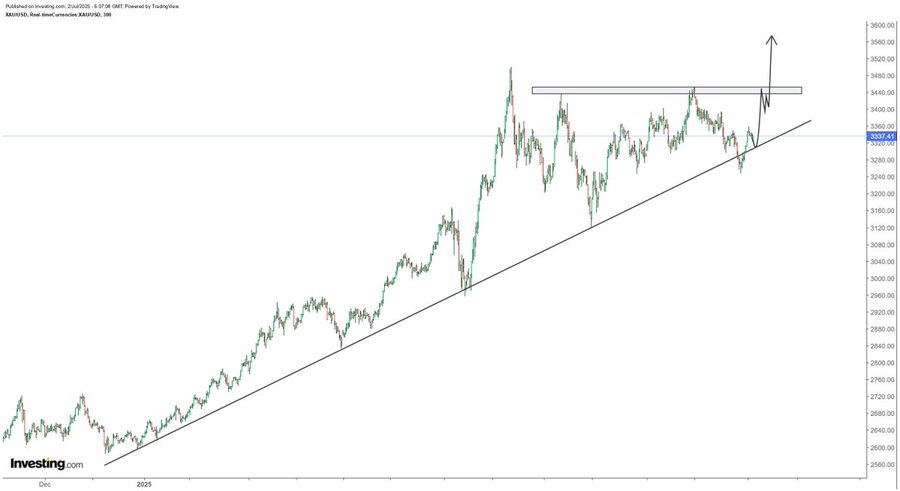
In addition, a horizontal resistance zone just below $3,450 continued to act as a ceiling. This level was tested by Gold prices in May and June, months before it was rejected. The recent breakout of this resistance, however, signaled increasing strength. At press time, Gold price stood at around $3,380, and the uptrend was still in place. Technical projections now pointed to $3,900 as a possible target.
Gold Price Broke Out of the Downward Channel
Meanwhile, another key development emerged from the broader structural pattern. Zerohedge reported that Gold price had broken out of its downward-sloping channel, formed since early June. This falling channel had kept gold in lower highs and lower lows, which would ultimately see the price drag below $3,300. The break of this structure signaled a change of sentiment in the market.
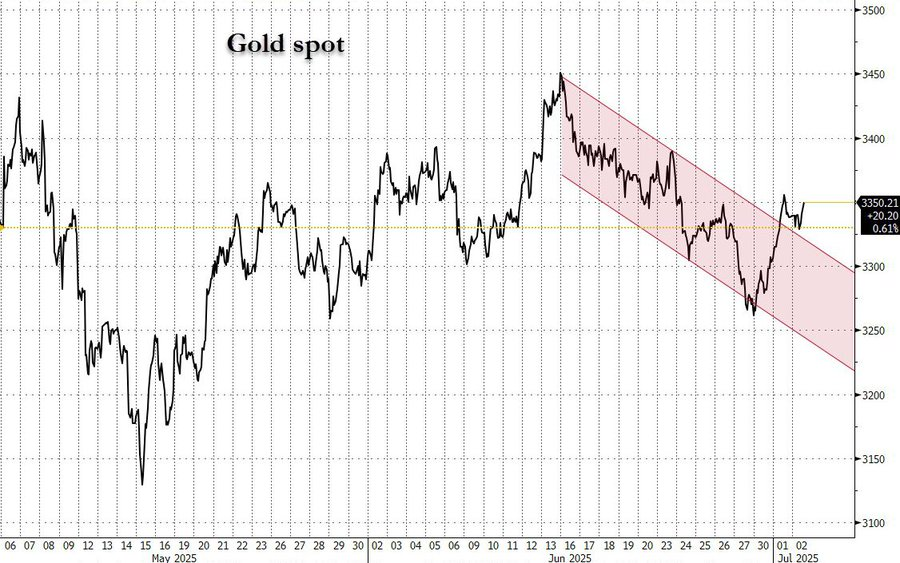
The upper channel boundary, located around $3,360, was breached with conviction. The breakout signaled the start of a new bull run, especially when the volume spiked during the breakout.
Moreover, this break also corresponded with Stoic Trader’s idea of Consolidation and Expansion which appeared to be entering phase 3. The chart showed a breakout from a short-term consolidation.
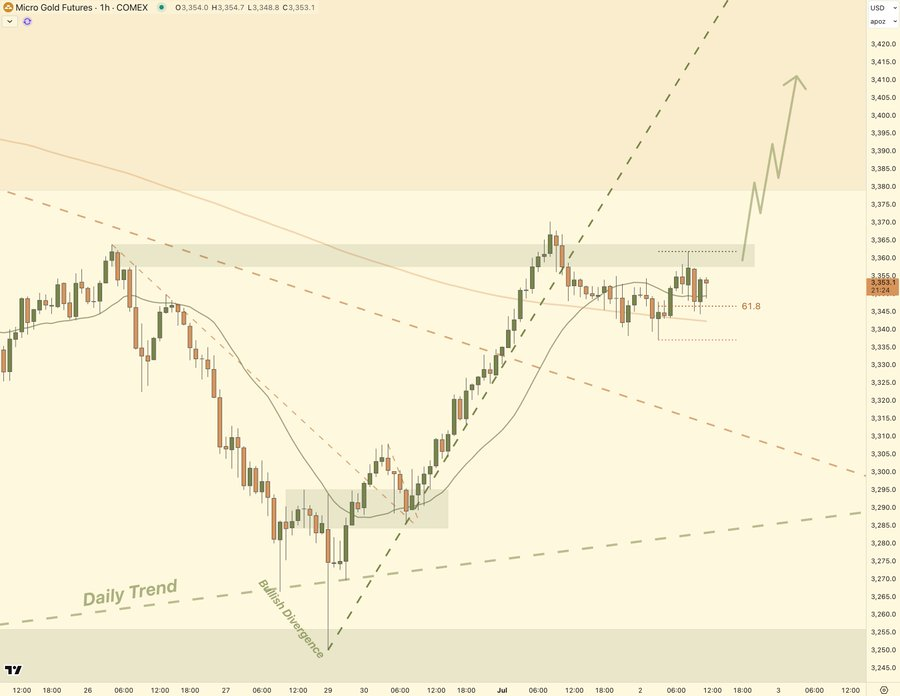
On the 1-hour chart, Gold price surged above a 61.8% Fibonacci retracement point at 3335 and created higher highs.
Volume and Liquidity Zones Reinforce $3,450 and $3,900
Liquidity positioning and volume analysis further affirmed the bullish structure. In a recent analysis of the chart, Michael van de Poppe explained that Gold price had already acquired liquidity over two important overheads at the $3,350-$3,365 level. This suggested that there could be aggressive short liquidations pushing the recent breakout, and further continuation was possible.
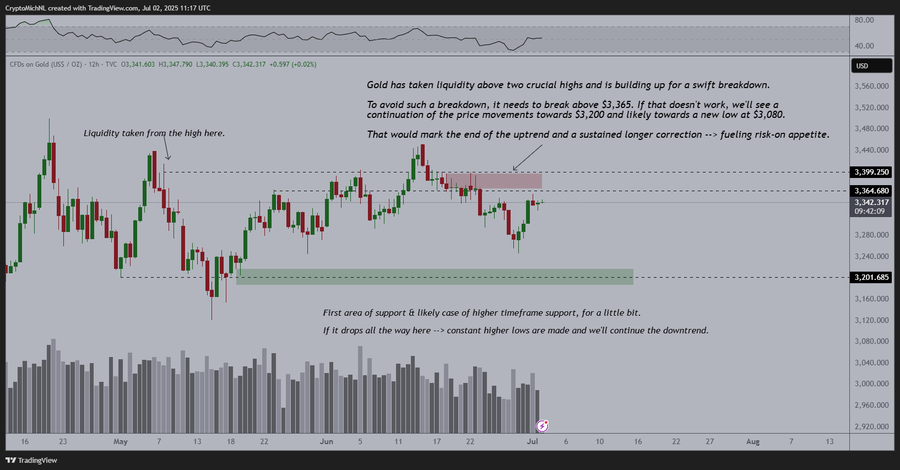
The chart also indicated support levels around the $3,320 level, where the buying interest has been very high in the past. If Gold price retest this zone, it can act as a launching pad to another rally.
Notably, the break above the price of $3,365 was deemed important in the continuation of the all-time highs. As long as Gold price does not break below $3,310 and continues to gain momentum, the bullish case will continue to hold.
The breakout structures seemed to support the rally, as well as favorable momentum indicators improving. The RSI indicators on the daily chart were neutral to bullish, and MACD values began to curve upwards. These signals often precede trend continuations, especially in commodities that follow macro-driven cycles.
Compression and Miner Support
Additionally, there was structural compression around the $3450 area, and this boosted the possibility of a sharp breakout. This resistance had been tested severally, thus causing the selling pressure to weaken. A clear breakout above the $3,450 would cancel the remaining barrier before targeting the $3,900 zone.
Moreover, the figure of $3,500 could serve as a midpoint level. Historical patterns suggest that once Gold price surpassed multi-month resistance, parabolic extensions often followed. Nevertheless, critical support at $3,310 should not be broken to maintain this bullish argument.





