
 astronaut
 Zylo Ecosystem
 Pearl
Pearl Sui
Sui Walrus
 Quantus
 Quant
Quant
Key Insights:
- Stellar’s RWA TVL reached $528.8M as of July 7, 2025, marking a 42% year-over-year increase.
- XLM crypto price surged past $0.2506 with strong green candle momentum, indicating buyer interest and short-term breakout potential.
- A symmetrical triangle pattern on XLM’s 4-day chart suggests imminent breakout as price nears the pattern’s apex with compression tightening.
Stellar native token, XLM crypto, displayed renewed activity as it traded close to a technical compression point. Concurrently, the network metrics indicated a steep increase in the real-world asset (RWA) sector, showing increased activity in the Stellar ecosystem.
XLM Crypto RWA Market Cap Rose to $528.8M
As of July 7, 2025, XLM crypto total value locked (TVL) was $528.8 million in real-world assets. The figure was a 42% increase from the same date in 2024, based on data from Stellar Development Foundation and Messari.
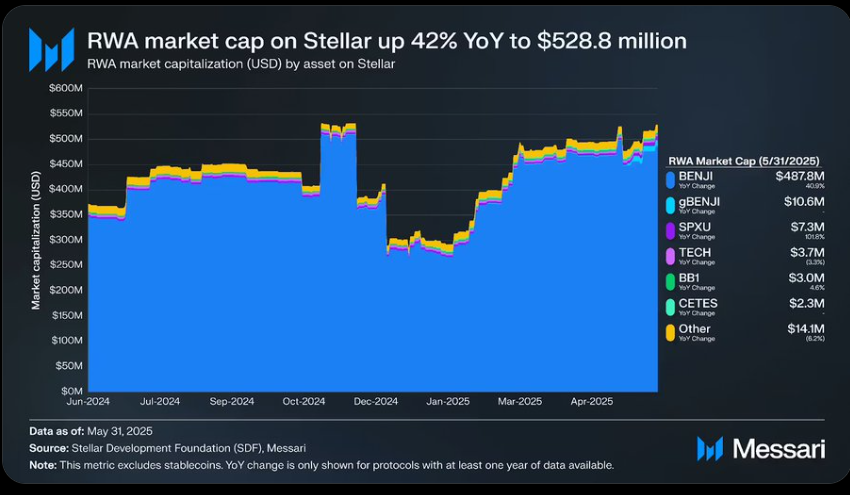
Notably, the increase in tokenized real-world assets on the Stellar blockchain reflected steady institutional onboarding and asset issuance over the past year.
Additionally, a majority of the growth has been attributed to the BENJI asset, which accounted for $487.8 million of the total market cap. Other contributors include gBENJI with $10.6 million, SPXU with $7.3 million, and TECH with $3.7 million.
The data indicated increased diversification of assets, but BENJI was the main source of the growth. This on-chain growth of tokenized value was on the current trend of expanding blockchain protocols interested in tokenizing established financial instruments.
XLM Crypto Surges Past $0.25 Amid Buyer Pressure
Meanwhile, XLM crypto has just seen a strong bullish move, as the price soared past the $0.2506 mark during the day. The action came after a consistent sequence of lows and at higher prices with stronger bullish bars that created a vertical trend across past sessions.
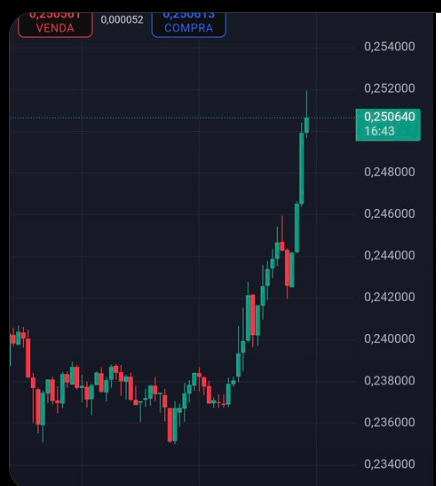
Chart data suggested a build-up of aggressive buyer interest in a short period, pointing to increased liquidity and short-term market participation.
The price action was marked by a series of green candlesticks with minimal retracement, which suggests lower resistance and sustained demand at current levels. The price previously hovered between $0.234 and $0.244 before the breakout.
Momentum indicators were in line with the breakout motion. They depicted increased volumes on key exchanges as the token broke through the short-term resistance.
Technical Chart Points to Symmetrical Triangle Formation
More so, in a higher timeframe chart, XLM crypto has developed a symmetrical triangle, having started earlier after the preceding upward spike. According to Steph, this structure has been developing over the past few months on the 4-day chart, where the price was contracting between fading highs and rising lows. The formation indicated reduced volatility and a coiling time, a precursor of a potential breakout.
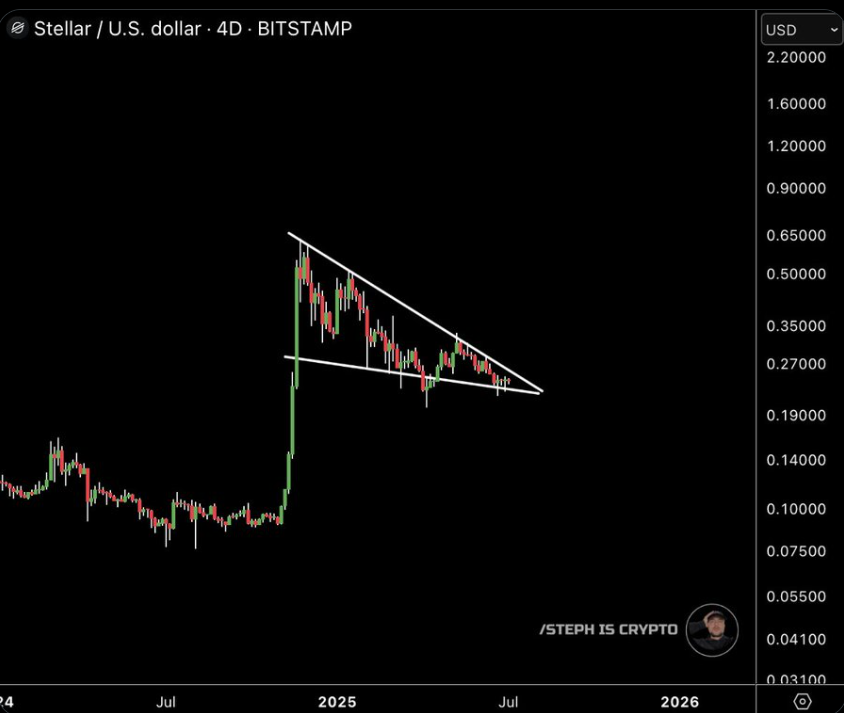
The apex of the triangle pattern was near, and recent price action suggested XLM crypto was testing the upper boundary. The converging trendlines put the asset under pressure to take a direction, and the contracting range indicates that a breakout is about to happen.
Historically, symmetrical triangle patterns often result in a continuation of the prevailing trend when formed after a strong move, though direction remains data-dependent.
Market Positioning and Breakout Scenario
Moreover, technical analysts and traders spotted the XLM crypto breakout prospects. The combination of bullish price momentum and rising network value has created a scenario where technical and fundamental indicators align.
Combined with a chart pattern that is nearly ready to complete, the fast pace of RWA tokenization on Stellar has incited speculations about when the next market movement might occur.
If XLM crypto confirms a breakout above the upper resistance of the triangle pattern, it may revisit previous resistance zones near $0.280 and $0.310. On the other hand, failure to break above the pattern could result in a retest of support around $0.220.
Disclaimer
This article is for informational purposes only and provides no financial, investment, or other advice. The author or any people mentioned in this article are not responsible for any financial loss that may occur from investing in or trading. Please do your research before making any financial decisions.





