
 astronaut
 Walrus
 Pearl
Pearl Bitcoin
 NEAR Protocol
 Zcash
Zcash Hyperliquid
Key Insights:
- Bitcoin has already been in a consolidation range between $100k-$110k for 8 weeks.
- The key liquidation cluster in a bigger time frame sat at $112k, which became the optimal target.
- Abraxas Capital deposited 1k BTC worth $108.23M into Kraken but still has 21,406 BTC worth $2.32B.
Bitcoin (BTC) continues to defend the price above the $100K level since scooping the level in early May. The cryptocurrency has been in a consolidation for 8 weeks, with Bitcoin price bouncing between $100K and $111.8K levels.
With a breakout imminent, as prices tend to break after accumulation, BTC could either surpass the ATH or descend lower. The price could also do both to pick the liquidity from both sides before the market decides where it’s heading. Will BTC surpass its ATH?
Is Bitcoin Price Breakout Imminent After 8-Week Consolidation?
Bitcoin has seen three rejections on a trendline, which was declining. BTC price has tested the zone, but this time it was challenging. An upward break about the trendline on increased volume may indicate a breakout to reach what could be called lower untapped liquidity at the $112K zone.
A fake-out could see BTC dip toward the region at 105K first and then proceed onwards. That’s due to a deviation just around the region where the breakout is occurring.
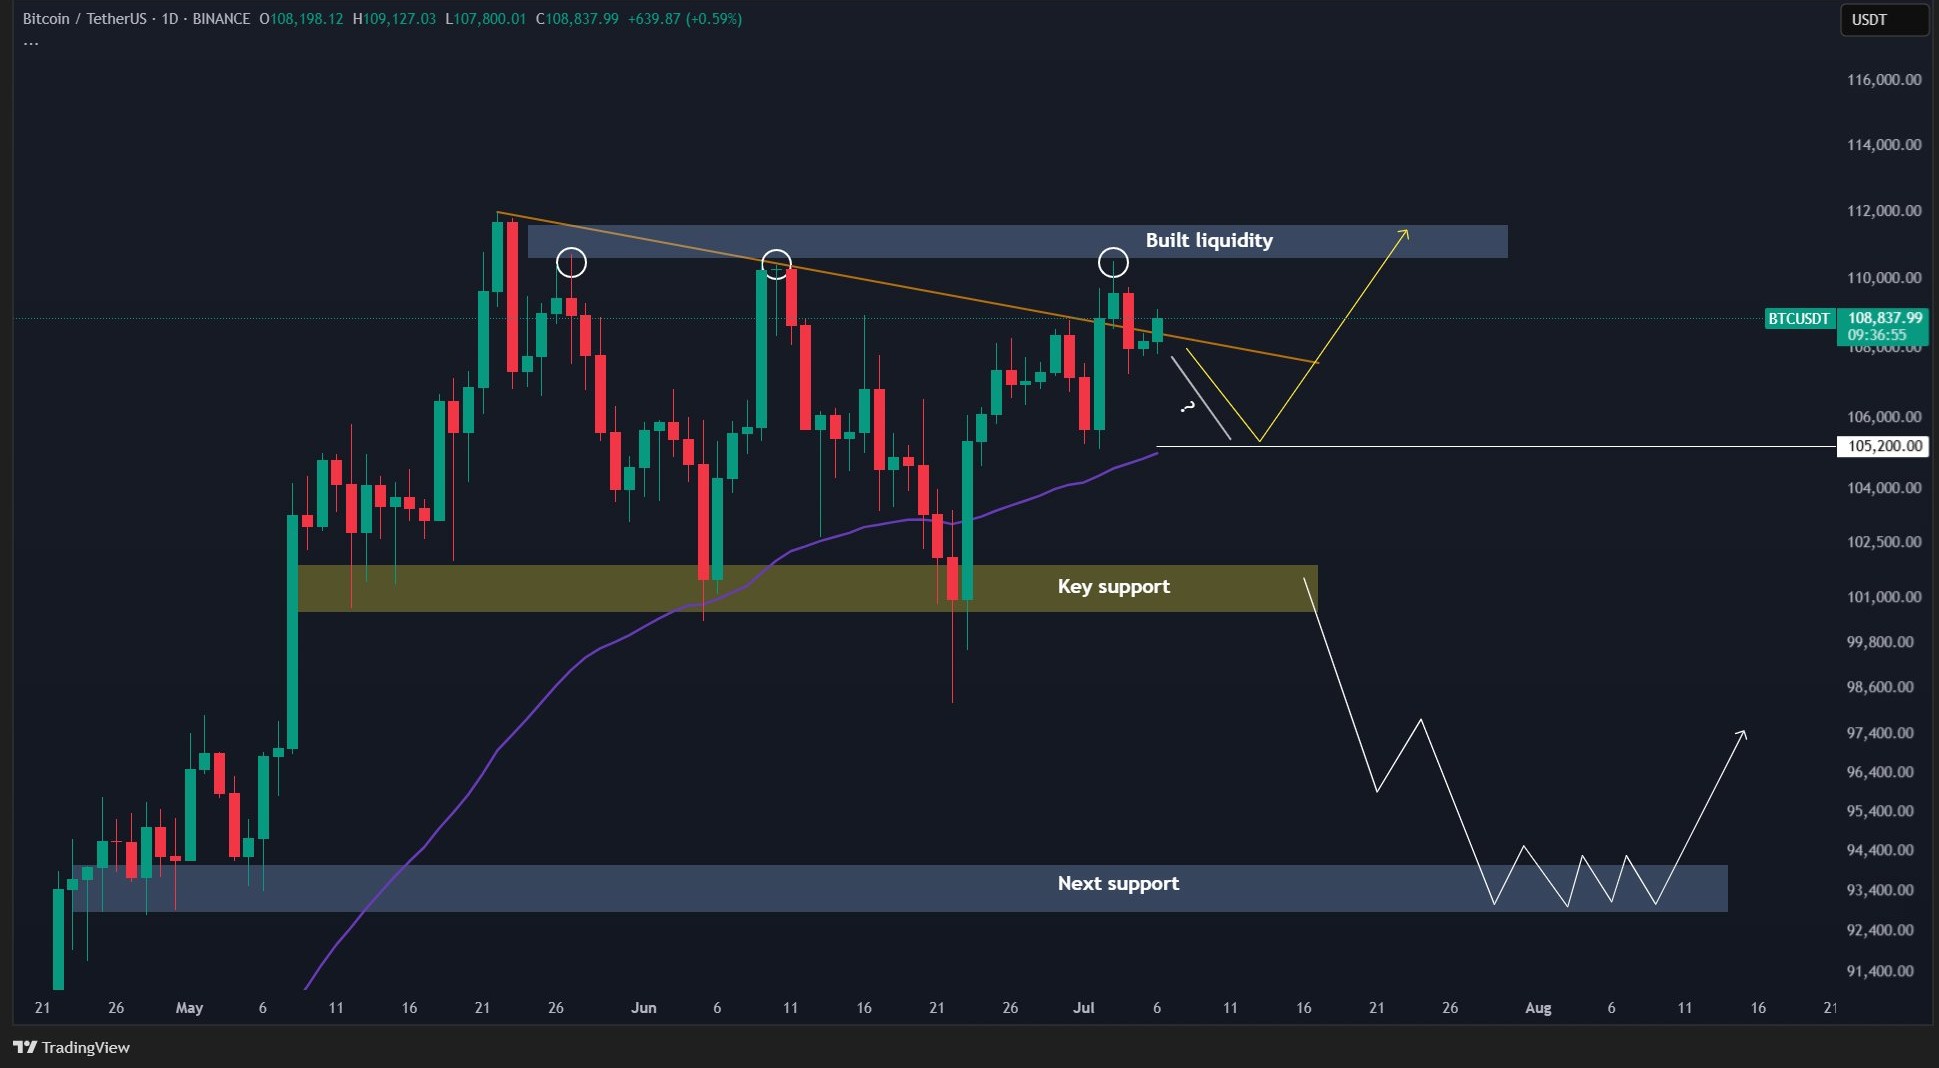
Another support was at the level of $100K, with its loss, the sentiment could become bearish. It would shift the focus to levels at $93K, about 7% lower. The support characterized by the 1W 50 EMA was pegged at $88K.
The important caveat here was that as long as BTC continued to remain above that, the bullish structure was intact.
Comprehensively, the risk to the downside was neither non-existent nor negligible. However, the players do not favor this to occur, as long as the current resistance turns into support. It means a breakout from the range could spark a rally.
BTC Key Liquidation Cluster In Higher Timeframes Say?
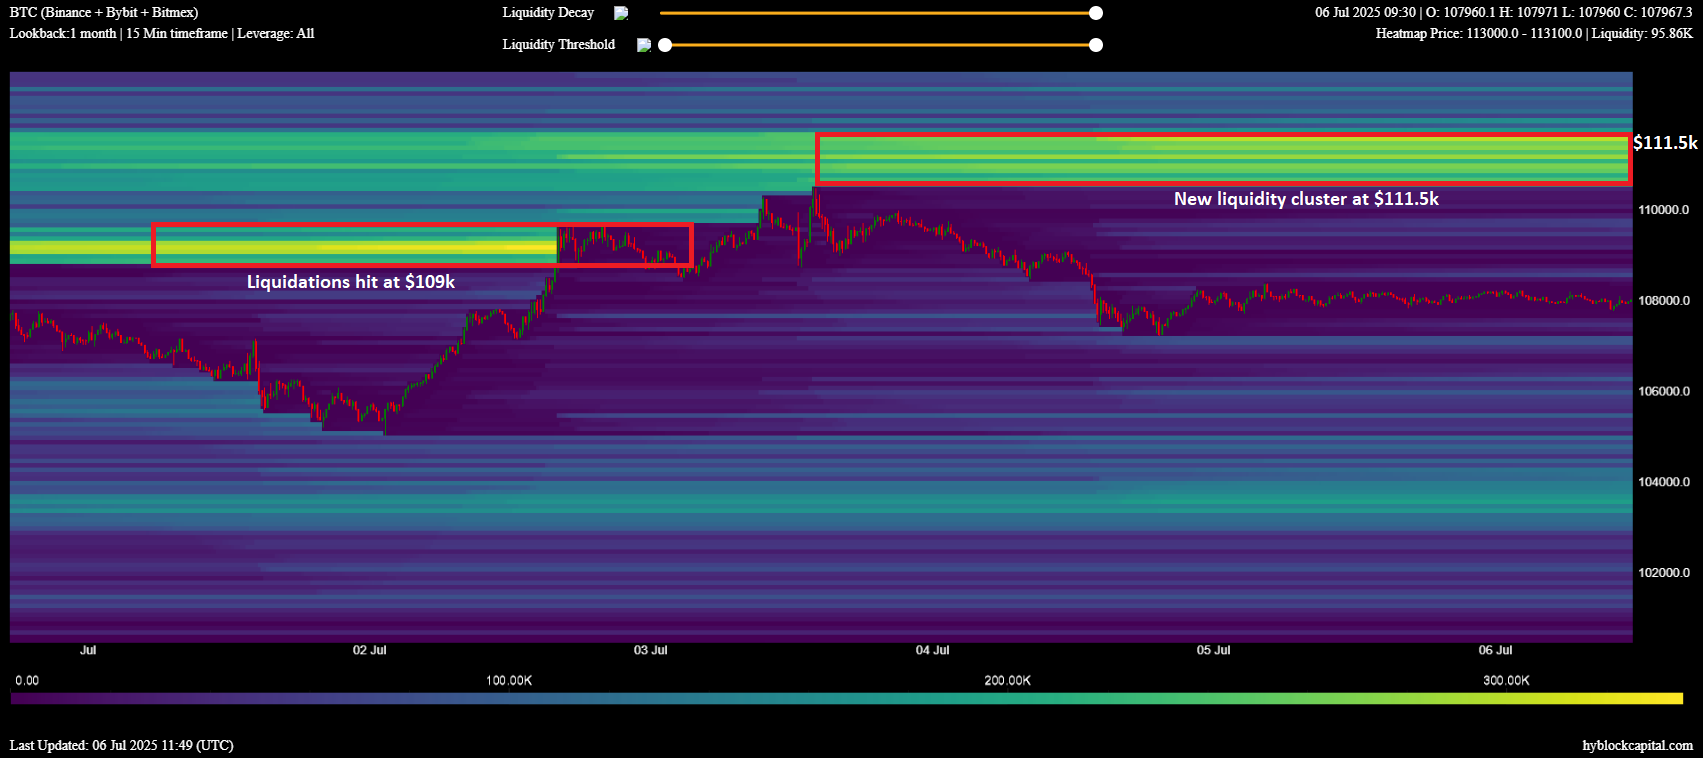
The apexes of the charts reveal two very important long and short liquidity zones for Bitcoin at $111.5K and $105.2K. This affirmed the levels aforementioned in the price analysis.
A large cluster of liquidity was developing at $111.5k to $112K. That said, this became a high probability target, as price has been attracted to these liquidation areas before.
The long/short liquidation proved that the primary support level of liquidation was $105.2k. It was in accordance with the daily 50 EMA. Given this, a potential deviation wick cannot be excluded prior to the breakout.
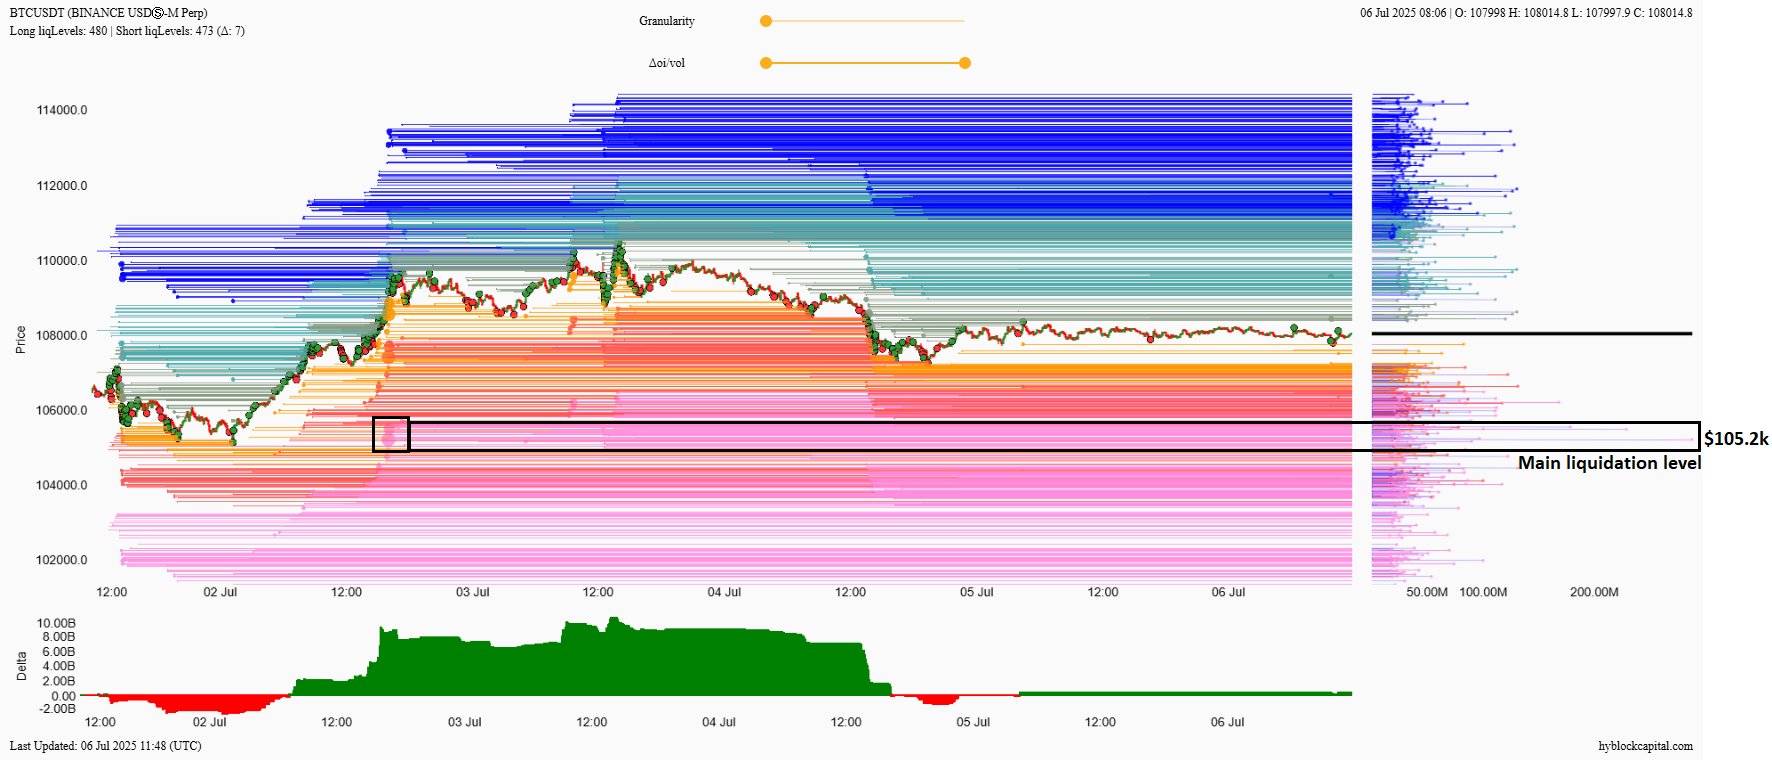
Should the price fall into this region, there is a possibility that the shorts may be trapped and then shoot up. It became a risk but offered insights on where stops and targets could be positioned.
A breakout above $109k, which showed momentum, may spark an upward rally to $111.5k. However, in case Bitcoin price cannot keep above $105.2k, it could soon escalate downwards. All these added confluence in the anticipation of a new ATH if the price swept the $109K liquidity.
Abraxas Capital Still Holding
Another reason to anticipate a move beyond $112K was the fact that institutions are still holding their tokens despite Abraxas Capital moving 1000 BTC or $108.23M to Kraken.
Even after doing this, the company maintained a huge cushion by retaining 21,406 BTC worth close to 2.32B. That implies that it did not transfer all its BTC coins, potentially anticipating a move higher.
The nature of partial offloading was seen in the previous transfers, amounting to 999.83 BTC worth $105.69M and 1,000 BTC valued at $100.78M.
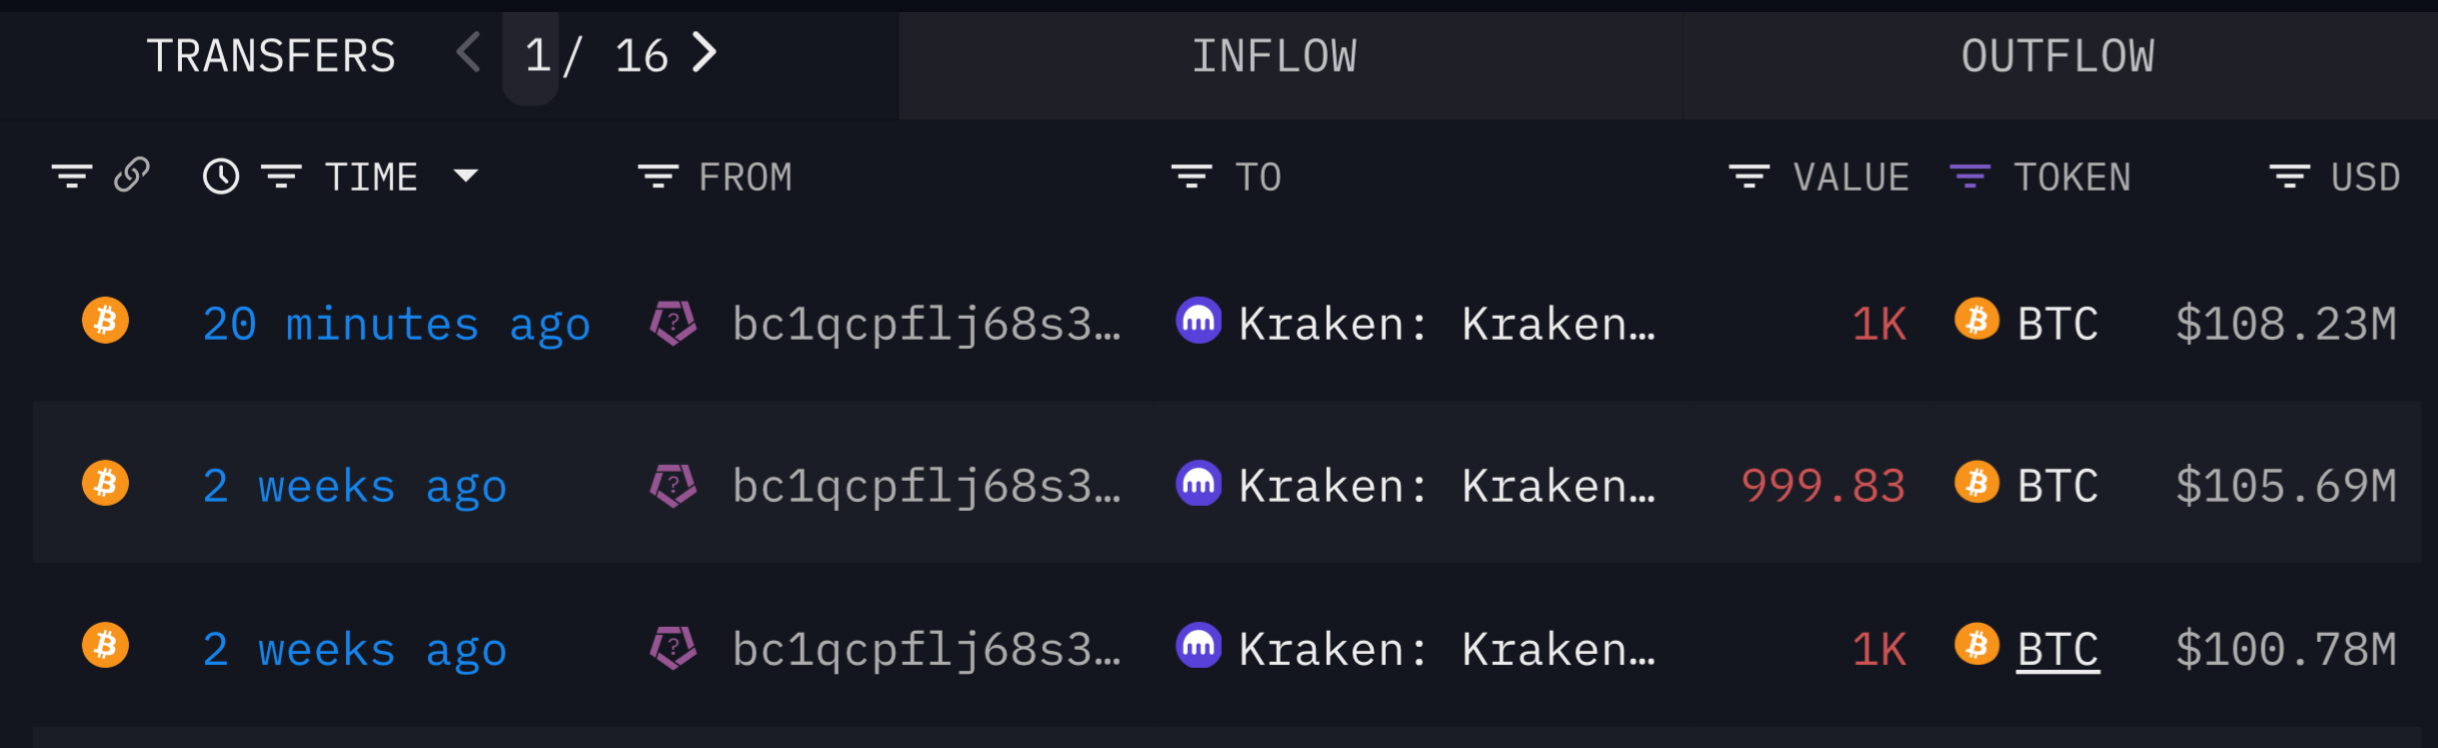
However, most of Abraxas Capital’s assets were yet to be tapped. It showed that Abraxas could be rebalancing or setting up liquidity without necessarily expressing 100% of bearishness.
Their long-term possession of position was an assurance that they were confident in the direction of Bitcoin. Even with this, Abraxas Capital was participating in short-term trades.
Disclaimer
This article is for informational purposes only and provides no financial, investment, or other advice. The author or any people mentioned in this article are not responsible for any financial loss that may occur from investing in or trading. Please do your research before making any financial decisions.




