
 Doge Pepe
 Bitway
 Pons
Pons Sui
Sui Pearl
Pearl Ronin
Ronin Zcash
Zcash

Key Insights:
- SUI stablecoin market cap rose 195.46% YTD, signaling strong DeFi and user growth.
- Weekly MA50 reclaim confirmed $2.30–$2.50 as support, boosting bullish momentum.
- Cycle chart projected $100B valuation, placing long-term SUI price target at $30+.
SUI price action continued to attract bullish commentary across technical and macro levels. Analysts tracked the asset’s upward trajectory through strong chart patterns, surging stablecoin activity, and key support retests. With a $100B market cap target and breakout calls from multiple experts, SUI price remained under the investor spotlight.
SUI Price Targets 10x Surge With $100B Breakout on Horizon
According to a recent post by analyst Sui Intern, SUI price appeared poised for a 10x surge targeting a $100 billion market cap in the current cycle. The analyst highlighted a rounded macro recovery into exponential gains should bullish continuity play through. The chart showed that it would rally to the $30-$35 area within the next 12-18 months.
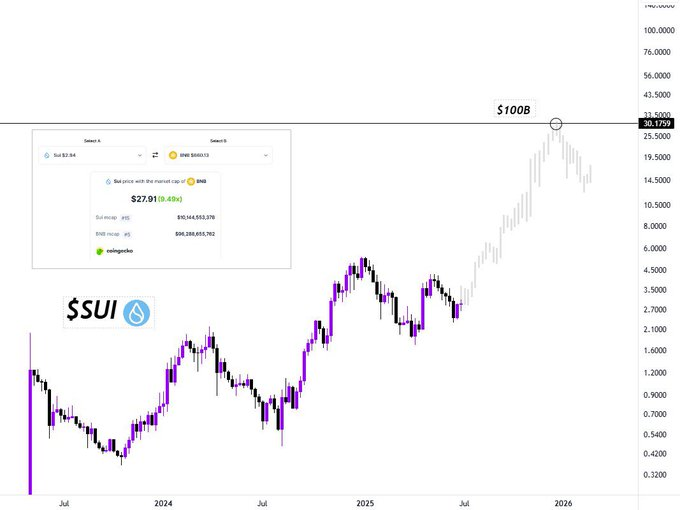
On-chain data demonstrated that momentum was backed by robust liquidity. The visualized $100B resistance area coincided with a speculative all-time high. If achieved, this would place SUI in the upper tier of altcoins by valuation. Analysts pointed out whether the asset experienced a complete bottom and returned to the bullish channel on a high timeframe.
Additionally, the long-term trend revealed a macro rhythm of consolidation and expansion. This trend has been repeated at least since the launch, and the bullish cycle thesis hence holds as indicated in the chart. The path toward $30 required a series of higher lows and volume-supported breakouts at each structural resistance.
SUI Price Held Weekly MA50
Technical analyst Atal confirmed that SUI price held above the weekly 50-day moving average. This action came as the result of a successful retest of the October 2024 high, which now serves as a confirmed support lever.
The chart indicated that this support zone was essential in sustaining the asset trend upwards.
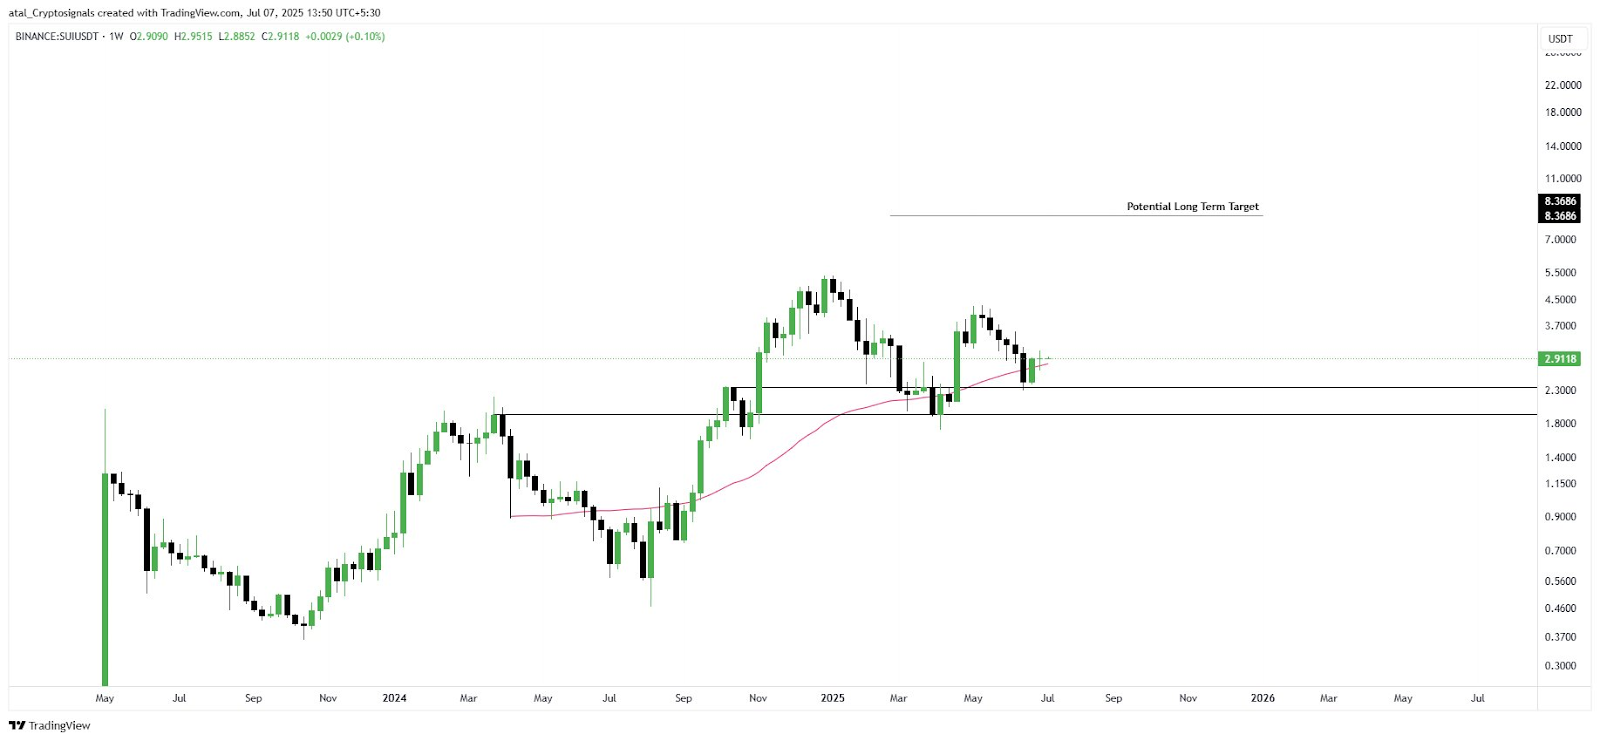
The chart indicated a possible long-term target of $8.68 in case the bullish structure is maintained. The price action also matched typical bullish continuation patterns in which recent resistance turned into support, leading to additional gains.
The rising trend of the moving average showed that buyers were purchasing in dips, and this was the sign of a trend following strategy. The price action was sitting above the moving average, with support lines, which gave analysts assurances on longer-term to mid-term forecasts.
Stablecoin Market Cap Rose 195% YTD
On-chain data posted by Torero Romero showed that the stablecoin market cap on SUI rose by 195.46% year-to-date. As of July 7, 2025, the stablecoin cap surpassed $1.1 billion, indicating a sharp rise in liquidity and user demand within the network.
This increase reflected broader ecosystem adoption, as stablecoins often mirror the strength of DeFi usage and TVL. The spike in market cap followed a multi-month uptrend starting in Q1 2025, confirming that SUI-based dApps and exchanges were drawing stable capital inflows.
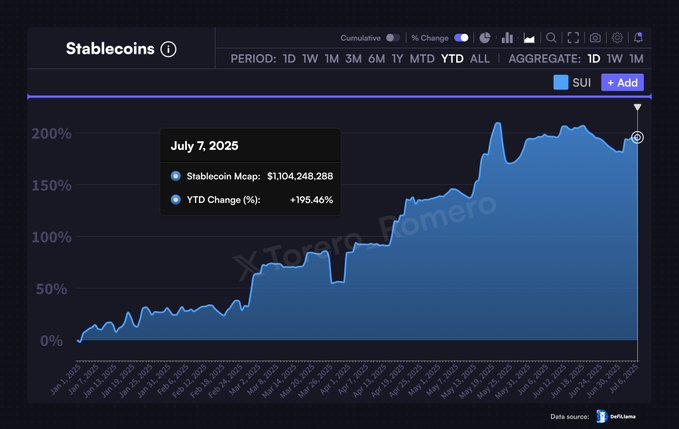
An increasing number of stablecoins on SUI increased its valuation metrics and risk-adjusted returns possibilities. Analysts observed that a rapid increase in stablecoin liquidity correlated with increased native token prices, especially in altcoins with an active user base.
Additionally, the stablecoin trend served as a macro indicator of user confidence. The projects with sustainable positive growth in liquidity-based volumes tended to move to adjacent phases of expansion in price. In SUI’s case, analysts saw this as a bullish reinforcement of the $8.68–$30 long-term roadmap.
Bull Flag Pattern Signaled $5.3 Breakout
Furthermore, analyst Solberg Invest identified a mid-term bull flag on the daily SUI/USD chart. It traded in a downward-sloping consolidation channel and then an impulsive movement in the direction of the upper boundary. If the pattern repeats, the next most critical resistance point would be the flagged target of $5.3.
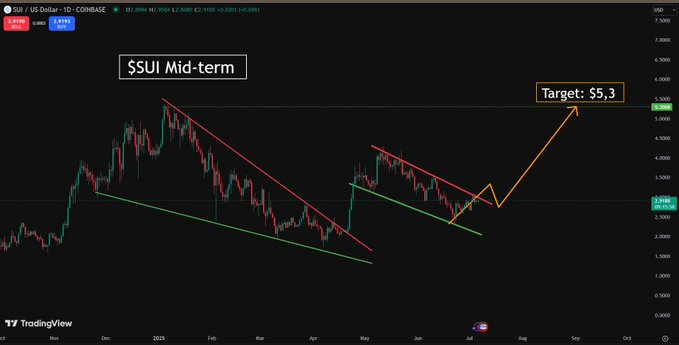
The chart exhibited an ascending and declining series of lows and lows, and thus, flags before a breakout. Having reached the lower line of the trend in late June, SUI price started to increase, with green candles being formed above the mid-range.
However, if the breakout does not occur, the chart indicates a retreat towards the lower bottom support of around $2.60. Nevertheless, the analyst was bullish until 2025 with anticipation of new highs after confirmation of the $5.3 mark. The pattern corresponded to past accumulation and impulse cycles evident since 2023.
Disclaimer
This article is for informational purposes only and provides no financial, investment, or other advice. The author or any people mentioned in this article are not responsible for any financial loss that may occur from investing in or trading. Please do your research before making any financial decisions.





