
 Bitcoin
 Ondo
Ondo Pudgy Penguins
 Walrus
 Pons
Pons Quantus
 NEAR Protocol

Key Insights:
- Active addresses on BNB chain surge past 3M, signaling strong user adoption.
- Binance coin price reclaimed $650 support, strengthening the bullish case for a price rally.
- The price is consolidating under resistance; a breakout above $700 looks imminent.
Binance Coin price has broken out of its recent minor channel. It is now trading firmly above the $650 mark. The breakout suggests growing bullish momentum, with BNB potentially heading toward the $700 level. After a period of consolidation, this move may trigger a stronger upward rally.
The cryptocurrency market witnessed a modest surge over the past 24 hours, with most major coins trending upward. Bitcoin is trading slightly above $109,000 and appears to be eyeing the $110,000 resistance level.
This movement brings BTC closer to its all-time high. Ethereum is maintaining a position above the $2,600 mark, showing steady support from buyers. Altcoins such as Solana (SOL), TRON (TRX), Dogecoin (DOGE), and Cardano (ADA) are also seeing small yet notable gains.
Despite the bullish trend, traders remain cautious as several assets hover near their support zones. The total crypto market cap currently stands at $3.4 trillion, reflecting a 1.39% increase. Meanwhile, the 24-hour trading volume has jumped by 11.30%, reaching $108.26 billion.
Analyst Predicts Binance Coin Price Bounce from Support
Crypto analyst Blasto has identified a potential scalp long opportunity on Binance Coin, according to a recent post on X. He highlighted a key support area, referred to as the “R-Key”, below current price levels, where he expects a bounce.
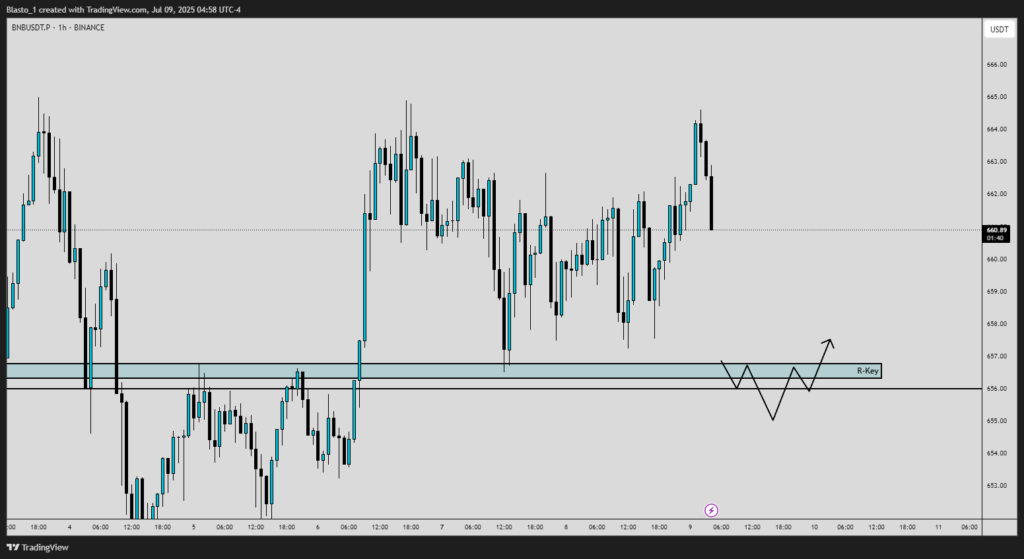
The chart shared suggests a possible drop into this zone, followed by a bullish reaction. That makes it an area of interest for short-term traders. The Binance coin price action shows consolidation and a sharp rejection, indicating market indecision around resistance.
BNB Chain Activity Surges in 2025
Recent data reveals that the number of active addresses on BNB Chain has been steadily increasing. Remarkably, there have been multiple days where the number has exceeded 2 million, with one exceptional upsurge rising above 3 million.
Spreading over 180 days, the chart shows that there has been a definite growth in the activity of the users. The activity has been steady and increasing, and when expressed in relation to the January to June period, the implication indicates more committed usage of the network.
Those numbers show increased real-life use in spite of the noise and uncertainty that prevailed in the market.
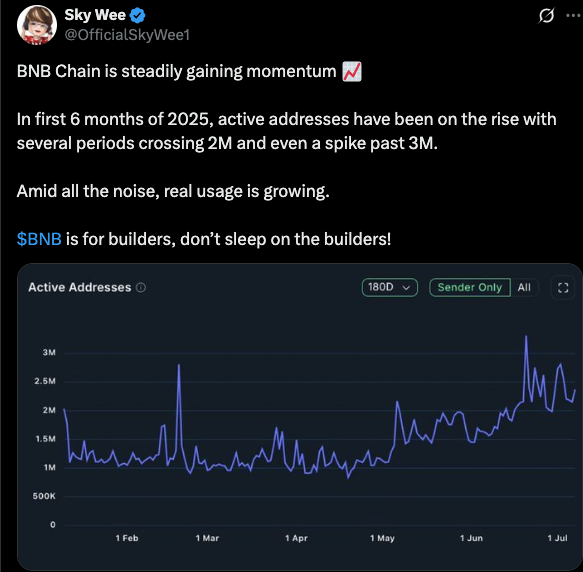
Such an increase in the network activity may indicate a bullish trend in Binance Coin price. The demand of BNB can grow with more people using the BNB Chain. In the past it is common that as utility and activity in a network go up the price tends to go up.
Market observers stated that they attribute this momentum to the confidence of the builders and long-term development of projects on the BNB Chain. If this trend continues, BNB might have a positive price action due to improved fundamentals.
BNB Price Signals Bullish Momentum as Buyers Eye $700 Target
Binance Coin price traded with modest gains today, as bullish momentum gathered pace on the 4-hour chart. BNB price closed at $663, reflecting a slight increase of 0.11% for the session.
BNB had proven to maintain the support at the price of $640 after recouping lows in the recent past. The price at first consolidated then broke a little higher, which showed possible force. Bulls were trying to cut their losses. Therefore, the market sentiment was in a cautious optimism mode.
The Relative Strength Index (RSI) has risen to 57.69. That indicated an increasing buying pressure, but not being in the overbought state. In the meantime, the MACD histogram had green bars, and the signal line was above the MACD line. These are signs of bullish price movements.
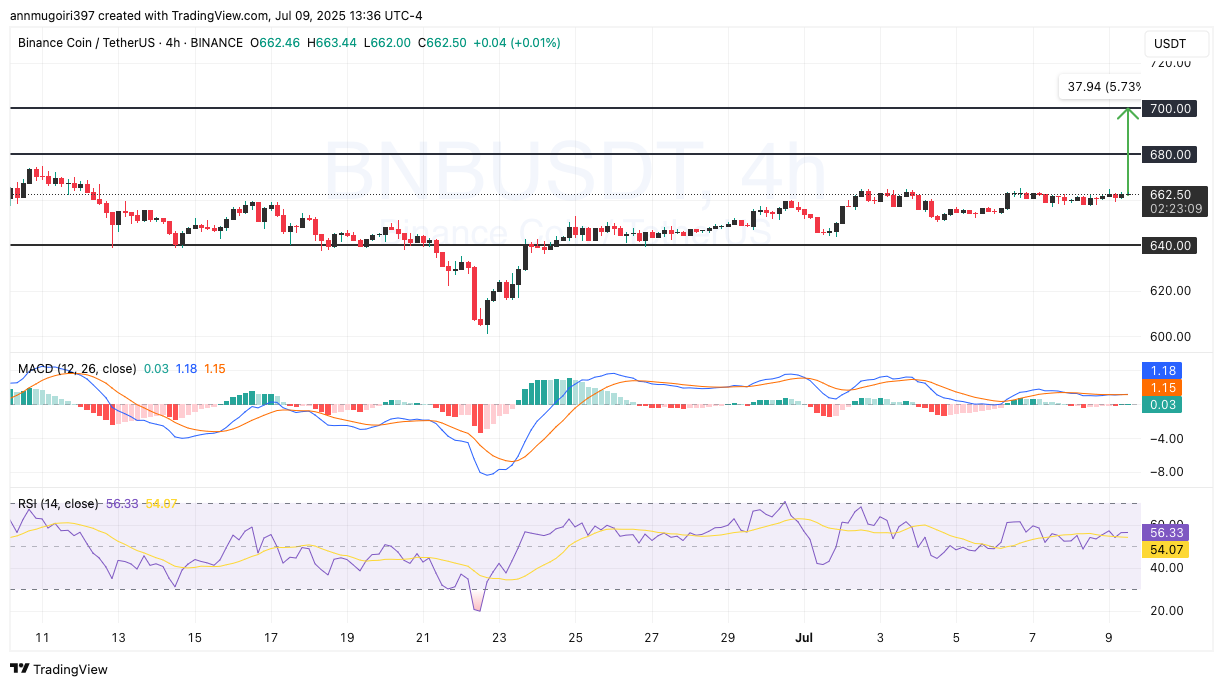
Resistance was observed near $680, with the next major target positioned at $700. A break above $680 could trigger a 5.7% upside move toward the $700 psychological level. This level also marked a key barrier last seen before the previous decline.
On the downside, $640 remained a critical support. A failure to hold above this zone could weaken the bullish setup and expose the $620 range.
Disclaimer
This article is for informational purposes only and provides no financial, investment, or other advice. The author or any people mentioned in this article are not responsible for any financial loss that may occur from investing in or trading. Please do your research before making any financial decisions.



