
 astronaut
 Zylo Ecosystem
 Pearl
Pearl Quantus
 Bitcoin
 Sui
Sui Bitway
Key Insights:
- Solana price consolidates below $170 after testing key resistance zones.
- The liquidation chart shows short squeeze risk near the breakout trigger.
- Sustained momentum may push the SOL price toward the $200 level.
Solana price could be on its way up towards its major resistance of around $170. This is after rallying strongly from its June lows. SOL recently tumbled above the $162-165 supply zone, only to fall to $168.
Solana has condensed around $163. It is currently facing a rejection test of the same range. This has been rejected several times below the level of $170. Should this consolidation prevail, then a fresh effort to crack the $170 price level may occur.
History shows that this level has been one of the robust resistances in the previous rallies. There were visible rejections in the second half of May and in the middle of June.
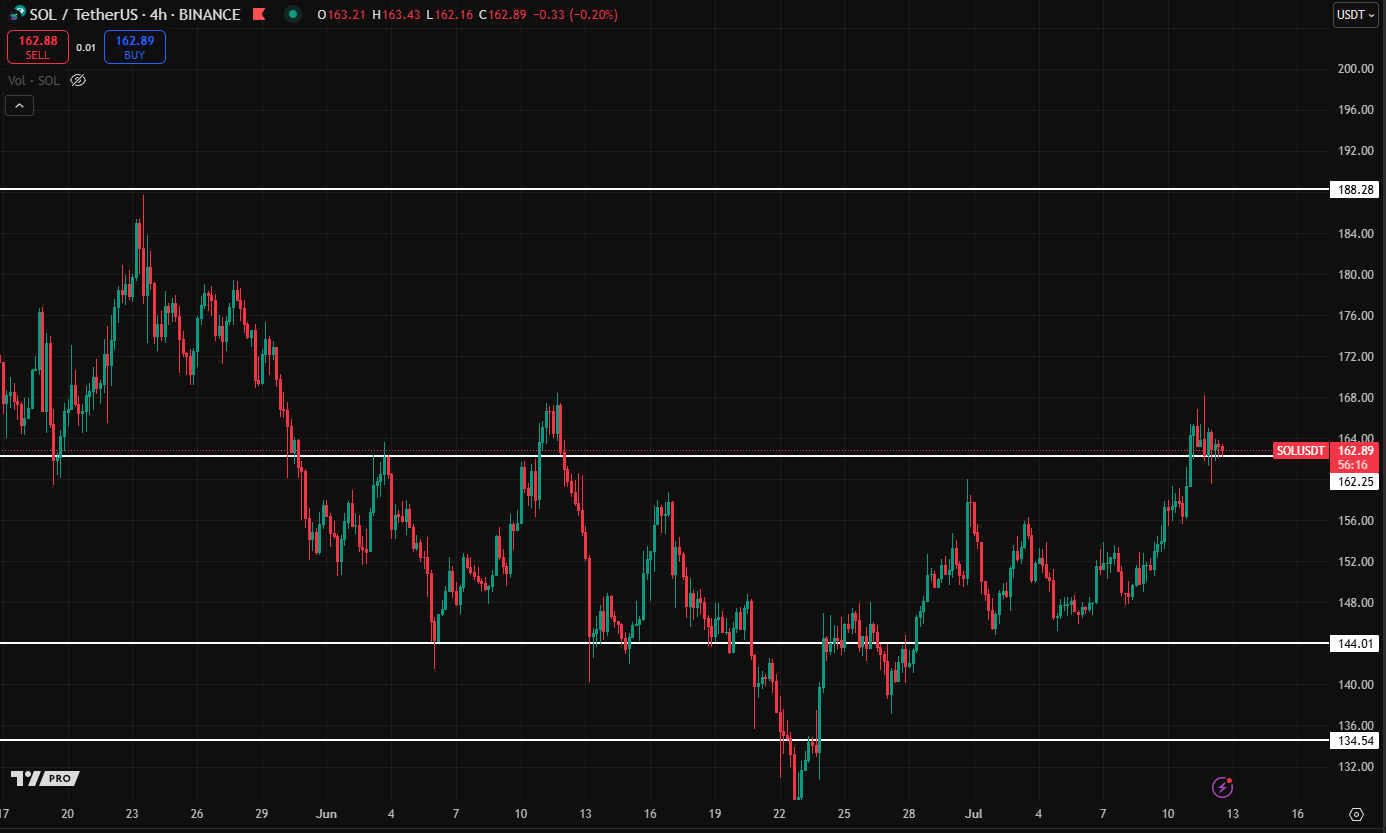
Solana price has been forming a bullish pattern since late June. A steady rise in higher lows emphasizes the continued upward momentum.
Short-term resistance is at $162.25. However, one should keep an eye on $144.01 and $134.54 below it. The levels served as pivots around these retracements in the past.
Solana Price Consolidates Below 200-Day SMA
On the daily chart, SOL surged beyond the 50-day and 100-day SMAs. It reached $150.55 and $153.50, respectively, signaling strong bullish momentum.
It is currently at around the 200-day SMA, at $164.34. This technical area has turned into a technical battleground. This is because traders observe whether the Solana price can regain a 200-day SMA convincingly or not.
The volume oscillator stood at 7.42%. This means the most recent volume levels are higher than average over the past 10 periods. It would indicate persistent buying pressure, but the delta of volume indicates net negative daily volume of -107.75K.
This is indicative of muddled order flow. SOL is currently trading near $160. It hasn’t closed above the 200-day SMA, which is $164.34.
The price range between $164 and $170 may continue acting as a congestion zone. A clear trend shift in the 200-day SMA with support is needed to break out.
Solana price managed to touch $163.90 only, where it met rejection briefly. This pushed it down to the boundaries of the price range around $160.
The 200-day SMA has acted as a strong resistance zone since late March 2025. This persistent barrier raises concerns for Solana’s upward momentum.
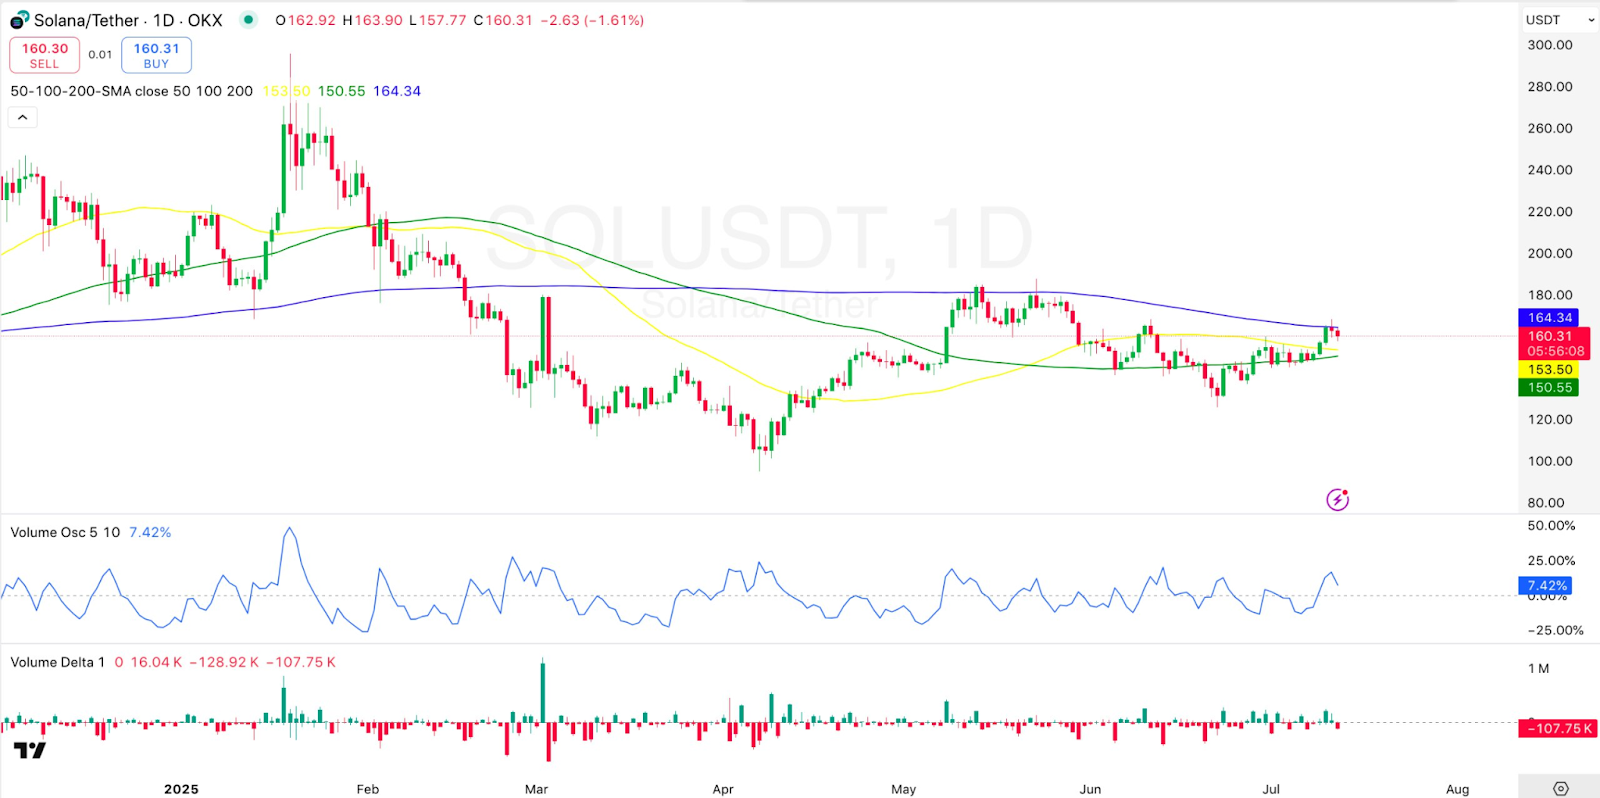
SOL remains above the 50-day and 100-day SMAs that are at $150.55 and $153.50, respectively. This framework puts SOL in a narrow range of short-term support and long-term resistance.
If Solana price drops below the 100-day SMA, traders may look to $145 for the next support level. This zone reflects a consolidation phase from late June, making it a key area to watch.
Derivatives Data Shows Persistent Long Liquidations
According to Coinglass data, total liquidations are still biased towards long positions. The latest wave in long liquidations was around early July.
This is when the Solana price was trying to break through its resistance level of $165. Short liquidations are not very high, indicating that there is no short squeeze as yet.
Liquidation data justify this trend in January-July 2025. Long-side liquidations occur with the local price peaks, and conversely, short-side liquidations occur near extreme drops.
That means traders are keen on placing bets on the upside. However, recent sideways price action has not confirmed further advances in the upward direction.
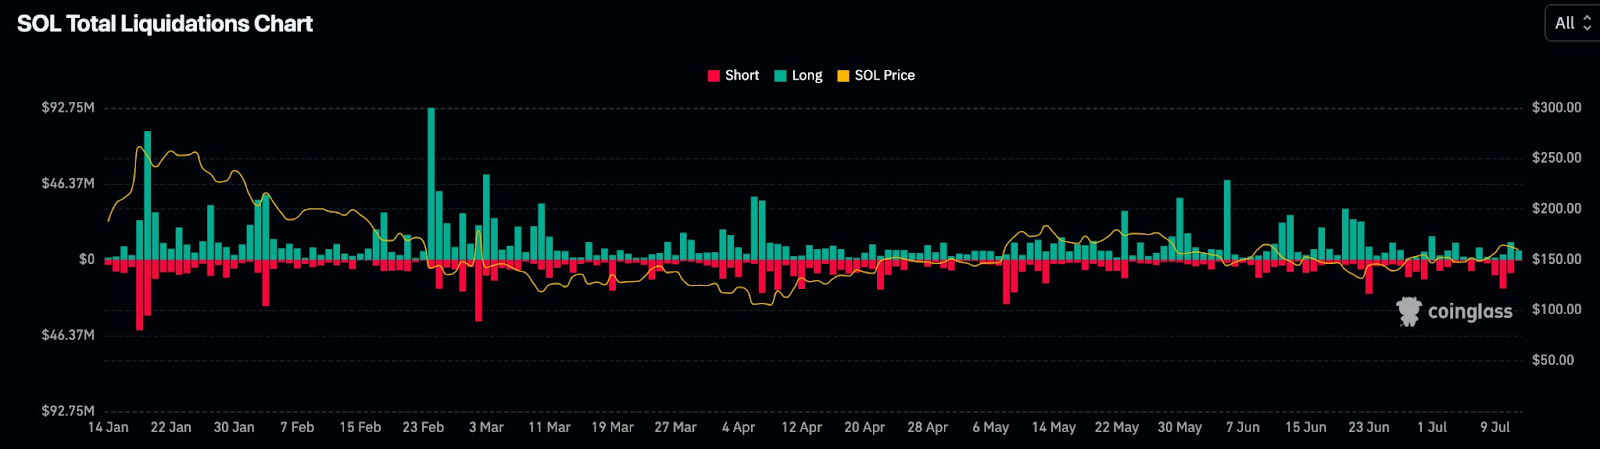
The price of SOL now is in the thin range of $153 and $164. A break over the 200-day SMA with large volume will signal the way to break out in a direction to reach 180, possibly.
However, selling would continue, and a dip to the low of $145 is probable should the support close to the price of $153 fail.
Disclaimer
This article is for informational purposes only and provides no financial, investment, or other advice. The author or any people mentioned in this article are not responsible for any financial loss that may occur from investing in or trading. Please do your research before making any financial decisions.





