Doge Pepe
 Zylo Ecosystem
 Crawlerpad
 Pearl
Pearl Quantus
 Starknet
 Quant
Quant

Key Insights:
- Stellar (XLM) price breakout signals bullish momentum from the falling wedge pattern.
- Total Value Locked surged 15%, indicating rising ecosystem confidence.
- Rapid 95% gain shows potential for continued upward volatility.
XLM price experienced a decisive breakout last week. It gained over 85% as market-wide momentum lifted major altcoins. Stellar broke free from a six-year symmetrical triangle, a pattern that had kept prices in a long-term consolidation phase.
The breakout followed a clean bounce off the upper resistance trendline, which had repeatedly capped previous rallies. XLM price jumped by 75% in the past month, showing strong bullish control over its short-term direction.
The rally picked up steam after XLM exited a descending parallel channel in early July. It is triggering a series of daily green candles. This movement signaled a shift in market sentiment, with buyers stepping in aggressively during the breakout phase.
Trading volume rose sharply during this period, increasing 55.27% in 24 hours to $3.31 Billion. This surge in volume supported the price rally. That confirmed strong interest and participation from market players.
Despite the rally, the XLM price still traded 51% below its all-time high of $0.9381, recorded on January 4, 2018. The breakout marked a critical technical milestone for Stellar.
Analysts suggested the move could set the stage for a potential 2x surge if momentum continued in the coming weeks.
Analyst Spots XLM Price Surge in Classical Breakout
Crypto analysts report a remarkable surge in Stellar, with prices almost doubling within three days. The recent breakout pushed XLM price up by approximately 95%, capturing the attention of traders and market watchers.
This upward movement followed a prolonged downtrend. During that time, Stellar traded under a descending resistance line. The breakout occurred in mid-July 2025, sparking a rapid price rally.
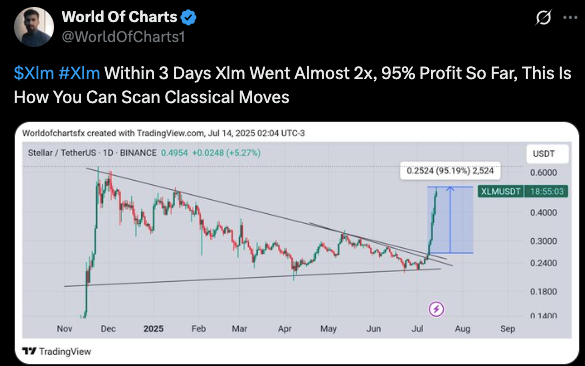
According to World of Charts, the XLM/USDT pair climbed from around $0.25 to nearly $0.50. XLM price action reflects a classic chart setup. There, sustained pressure near resistance gave way to a sharp bullish breakout.
Stellar DeFi Ecosystem Sees Surge in TVL
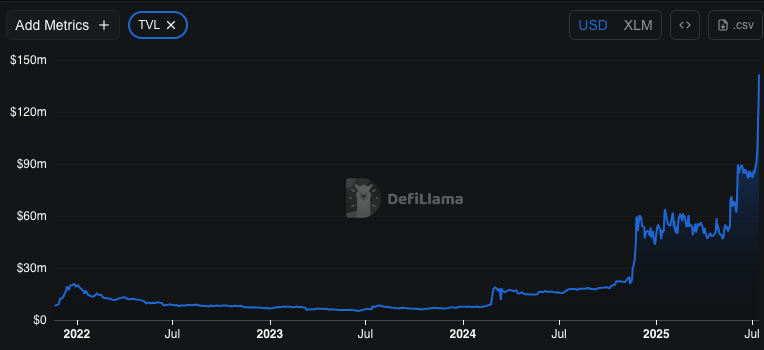
The decentralized finance (DeFi) ecosystem on Stellar increased activity during the past 24 hours. The total value locked (TVL) has climbed to $141.71 Million. This marks a sharp increase in funds added. In just 24 hours, TVL grew by 15.92%.
This increase shows the general surge of user confidence and contribution to the DeFi services within Stellar. The existing stablecoin market cap on the network is $627.11 Million. Also, this underlined a firm basis of digital assets support.
Stellar decimal smooth trading platforms (DEXs) also registered impressive trading volumes. The total trades on DEXs were $16.78 Million in the last 24 hours. This indicates burgeoning liquidity and utilisation.
In the meantime, $2,445 was received through application-generated fees over the same time slot. This number indicates moderate but steady user activity regarding decentralized applications developed on Stellar.
The projects in the Stellar ecosystem have received about $3 million so far. Such an amount of funding indicates the rise of the ecosystem with stable growth.
XLM Price Retreats After Hitting Key Resistance
XLM price hovered at $0.4567, surging over 8% in recent sessions before facing a sharp pullback. The RSI has relaxed out of an overbought area of 64, indicating a slowdown in bullishness.
The MACD line crossed the signal line above in the MACD indicator. In the previous case, this indicated a strong uptrend. However, the shrinking differences between the lines meant the bullish momentum was experiencing a decline.
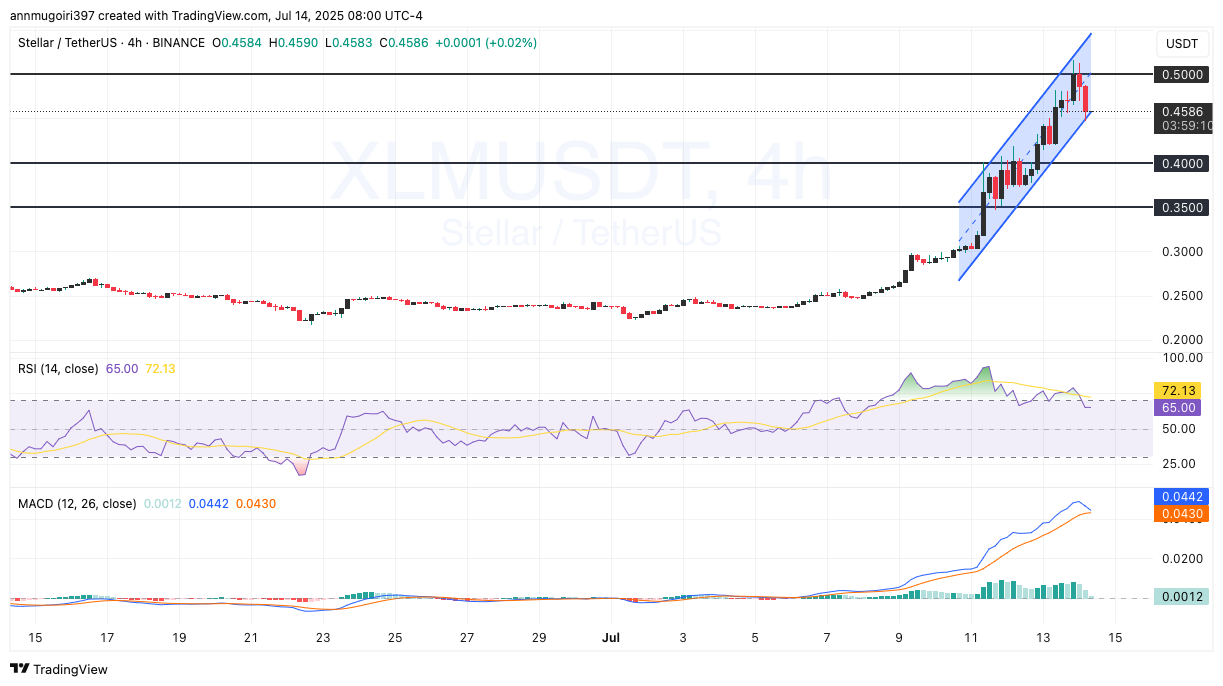
A decisive close below the channel’s lower boundary could accelerate the correction. Immediate support levels stood at $0.40 and $0.35. These zones may act as cushions if selling continues.
On the upside, bulls must reclaim the $0.50 mark with conviction if Stellar rebounds. If that level is breached, a new rally could follow. Fibonacci extensions and resistance zones suggest $0.55 or even $0.60 targets.
Disclaimer
This article is for informational purposes only and provides no financial, investment, or other advice. The author or any people mentioned in this article are not responsible for any financial loss that may occur from investing in or trading. Please do your research before making any financial decisions.