
 Zylo Ecosystem
 astronaut
 Pearl
Pearl Walrus
 Starknet
 Pudgy Penguins
 Bitcoin

Key Insights:
- Ethereum price has formed a highly bullish golden cross pattern.
- Data shows that the Ethereum supply in exchanges has started falling.
- Ethereum ETF inflows have kept soaring this year.
Ethereum price rally has stalled at a crucial resistance level since February as investors started to book profits. ETH was hovering at $3,000 on Tuesday, July 5, up by 115% from its lowest point this year.
ETH price has formed the highly bullish golden cross pattern and moved above the key resistance level at $2,873. Its exchange-traded fund (ETF) inflows are surging, and its stablecoin growth is soaring, pointing to more upside.
Ethereum Price Golden Crossover Signals More Gains Coming
The daily timeframe showed that the ETH price had crashed to a low of $1,390 in April, but it has now rebounded to over $3,000 today. It has moved above the 50% Fibonacci Retracement level at $3,068, confirming the bullish momentum.
Ethereum price has moved above the key resistance at $2,873, the upper side of the bullish flag pattern. A bullish flag consists of a vertical line and a rectangle pattern. It is one of the most bullish patterns in technical analysis.
Most importantly, the coin has formed a golden cross pattern. It occurs when the 50-day and 200-day Exponential Moving Averages (EMA) have crossed each other.
Further, the Momentum and the Relative Strength Index (RSI) have all pointed upwards. It is a sign that the coin is still gaining momentum. Therefore, the token is likely to continue soaring.
ETH bulls are targeting the psychological level of $4,000. A move above that level will signal more gains, potentially to $5,000 over time.
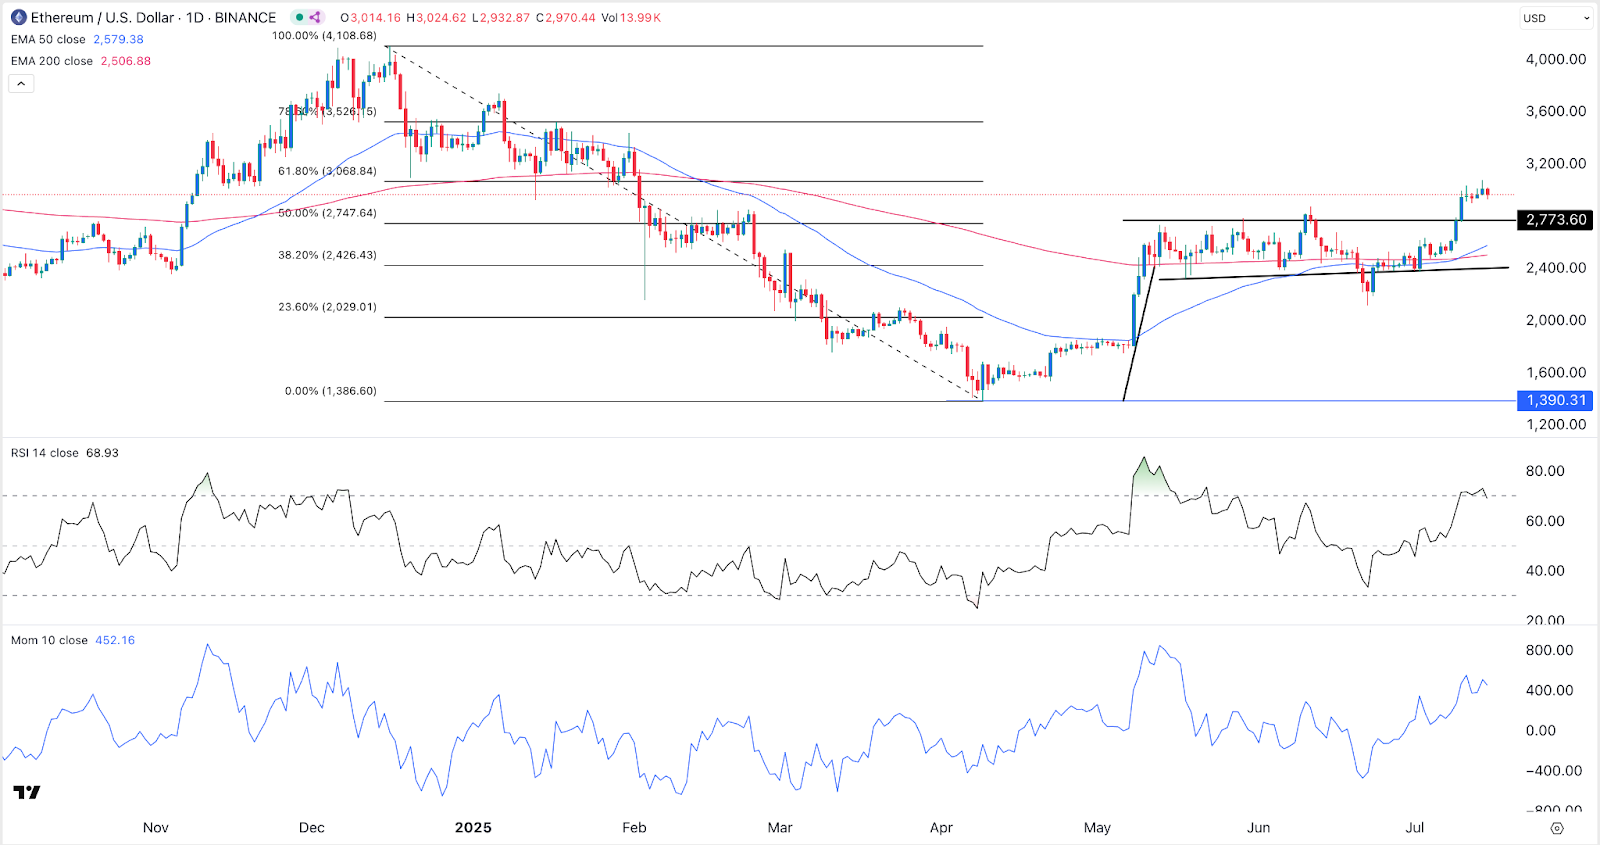
On the other hand, a crash below the support at $2,500, the 200-day moving average, will invalidate the bullish ETH price forecast. Such a move will point to more downside, potentially to the year-to-date low of $2,000.
ETH ETF Inflows are Soaring
Ethereum price has numerous catalysts that may push it higher in the coming months. The most important one is that demand continues to go up this year, helped by the Americans.
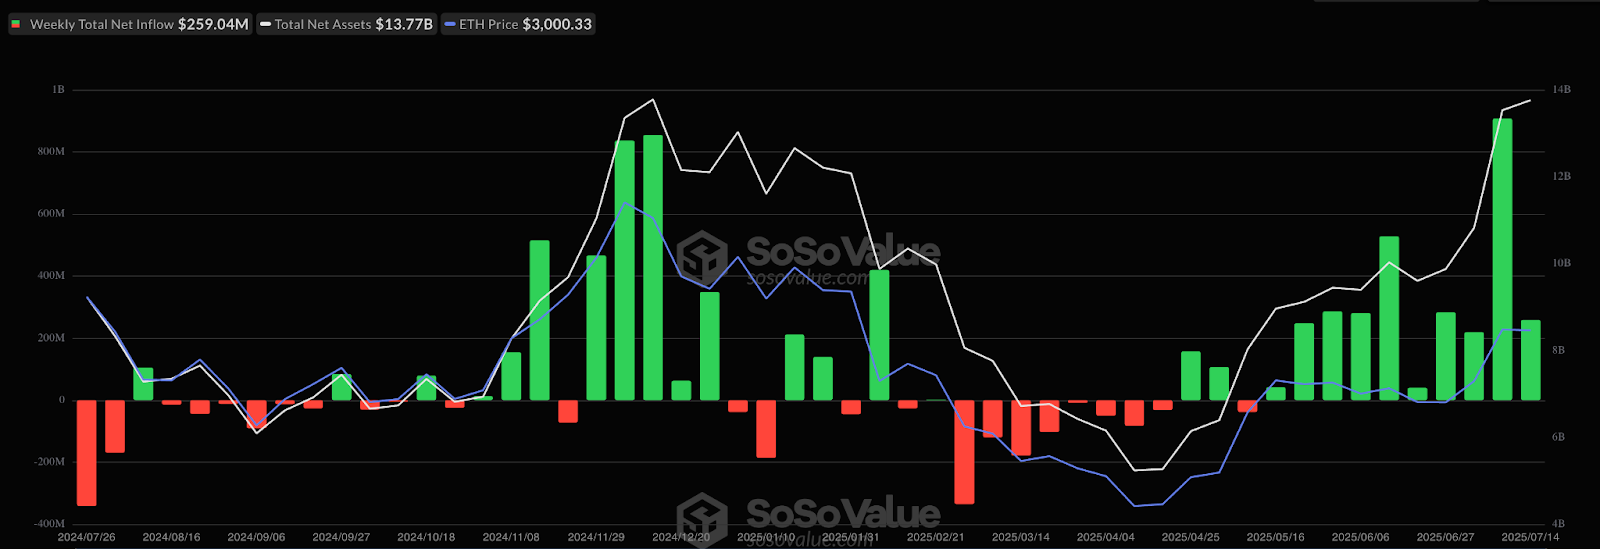
SoSoValue data shows that spot Ethereum ETFs added over $259 million on Monday, up from $204 million on Friday. These funds have had positive inflows in the last seven days.
The funds have experienced consecutive inflows for nine weeks and for four straight months. This trend is gaining momentum, increasing from $66.25 million in April to $564 million in May, $1.16 billion in June, and $1.35 billion this year.
Demand is also jumping in the futures market, where the futures open interest are soaring.
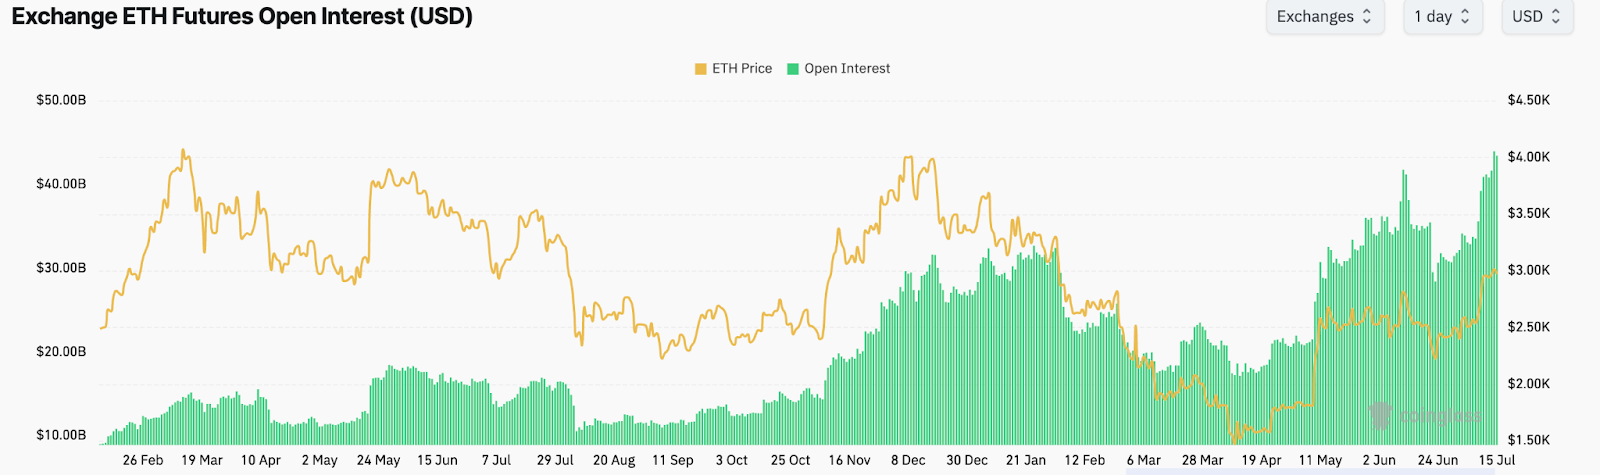
The chart shows that the futures open interest soared to an all-time high of $44 billion, up from the year-to-date low of $17 billion.
ETH Supply is Plunging
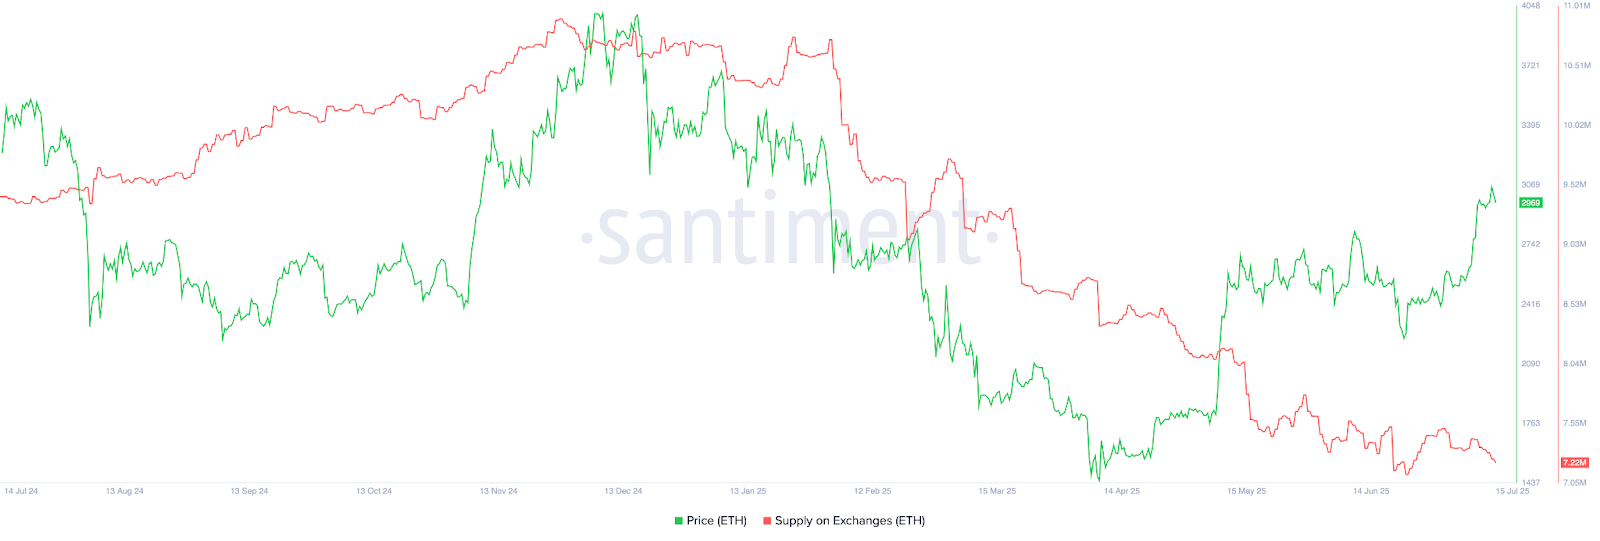
The ongoing Ethereum ETF demand is happening as the supply in exchanges continues falling. Santiment data shows that the supply of ETH on exchanges has plummeted to 7.23 million. It is down from 10.89 million in November last year, and that’s a 33% decline.
Falling exchange supply is a sign that investors are highly optimistic about the Ethereum price as they move their coins from exchanges into self-custody, which is a bullish catalyst.
Further data shows that Ethereum is gaining market share in the stablecoin industry. The total supply moved to $131 billion in the last 30 days, with most of them being Tether and USD Coin. Its adjusted volume has jumped by 65% in the last 30 days to over $560 billion.
Will Ethereum Price Keep Soaring?
The Ethereum price has jumped in the past few weeks, aided by rising demand from Wall Street investors and a falling supply on exchanges. A jump in demand and falling supply explain why the coin is soaring. This means that the token will keep rising in the coming weeks.
Disclaimer
This article is for informational purposes only and provides no financial, investment, or other advice. The author or any people mentioned in this article are not responsible for any financial loss that may occur from investing in or trading. Please do your research before making any financial decisions.




