
 Doge Pepe
 Zylo Ecosystem
 Pearl
Pearl Optimism
 Bitway
 NEAR Protocol
 Pons
Pons

Key Insights:
- SUI price breaks key resistance with strong on-chain support and volume.
- TVL on Sui rises sharply, signaling increased DeFi network traction.
- SUI’s uptrend outpaces Solana as traders eye new highs.
The SUI price formed a bullish reversal structure on weekly charts, suggesting a potential breakout. The move followed a multi-month consolidation and strong on-chain support.
The pattern resembles a rounded bottom, or cup-and-handle, often linked with trend reversals.
Sui Price Hanging on to Support Levels
Support levels have been established at the $0.0170 price. This is where price action has been holding up. Overhead resistance has also been tested several times, and is finally taking its place. The neck level of this accumulation range is at a critical breakout level.
A breakout above this neckline will only be confirmed by a weekly close above this neckline. After that, it may head towards the Fibonacci retracement lines drawn on the chart.
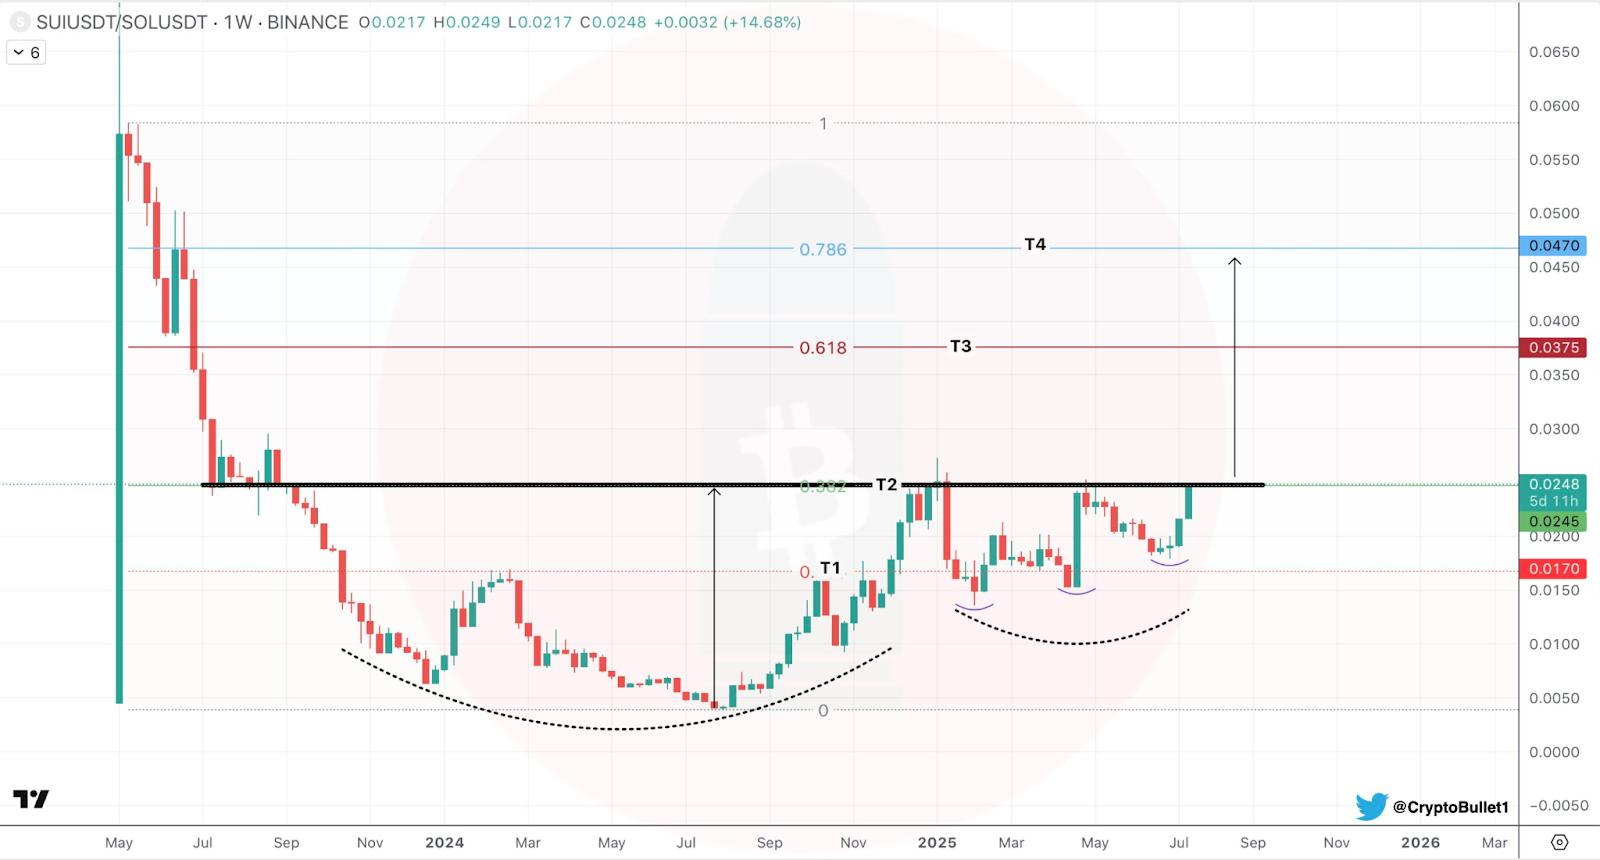
The Fibonacci analysis has distinct target levels. T2 is the same as the previous resistance ($0.0305), while T3 is the same as the 0.618 retracement ($0.0375). T4 is the same as the 0.786 retracement ($0.0470) as an extension over a longer period.
If the Sui price holds up above the neckline area, these levels can serve as magnet areas on which the Sui price will search next.
The existence of the double rounded bottom has reinforced the argument of a trend change towards $SUI. Price stability and volume confirmation above the neckline will continue to prevail as an indication of further continuation.
Sui TVL on a Massive Spike
DeFiLlama on-chain metrics also confirm this positive argument. At present, Sui had more than 2.211 billion in total value locked (TVL) as of press time, an increase of 7.57% over 24 hours. This makes Sui one of the fastest-developing Layer 1 ecosystems by DeFi capital flows.
In the meantime, the chain fees and the revenue of the previous 24 hours were equal ($50,255). This signified good conditions for the network’s activity.
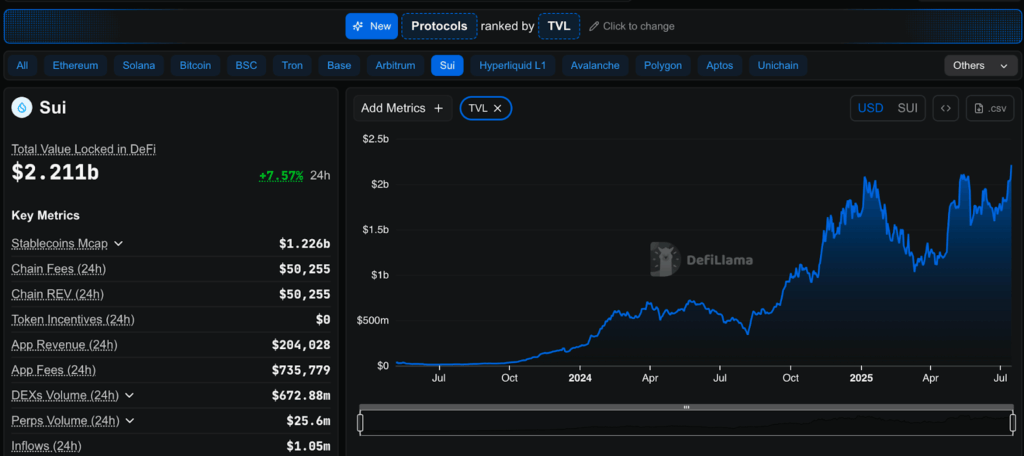
App revenue stood at $204,028 and app fees at $735,779during the same period. This stresses the fact that dApps on Sui are an emerging reality and creating on-chain demand.
These metrics, particularly when linked with a powerful price trend, indicate that the use of the network and the involvement of users are growing simultaneously with the interest in the market.
The past week enjoyed a decentralized exchange (DEX) volume of $672.88 million on Sui, comparable to other high-activity chains.
Trading volumes of perpetuals are also potent at $25.6 million. Net inflows came to $1.05 million, demonstrating favorable sentiments and net user deposits in the ecosystem.
Intraday structure confirms upward trajectory on Sui Price
Looking at more charts, we see that the Sui price has been trading in a clear trend cost channel. Since the beginning of July, the Sui price has considerably gained from approximately $2.20 to a value above $4.00, with price consolidation at the upper side of the channel as of the most recent candle.
No net buyer overshadows recently, as seen by the indicators. The volume delta indicator shows a positive market as it displays bullish bars. On the other hand, the Awesome Oscillator (AO) stands at 0.3792, indicating positive values.
This would indicate a further bullish run on the intraday scale. However, short-term consolidation or retesting within the channel will likely occur as the market absorbs recent gains.
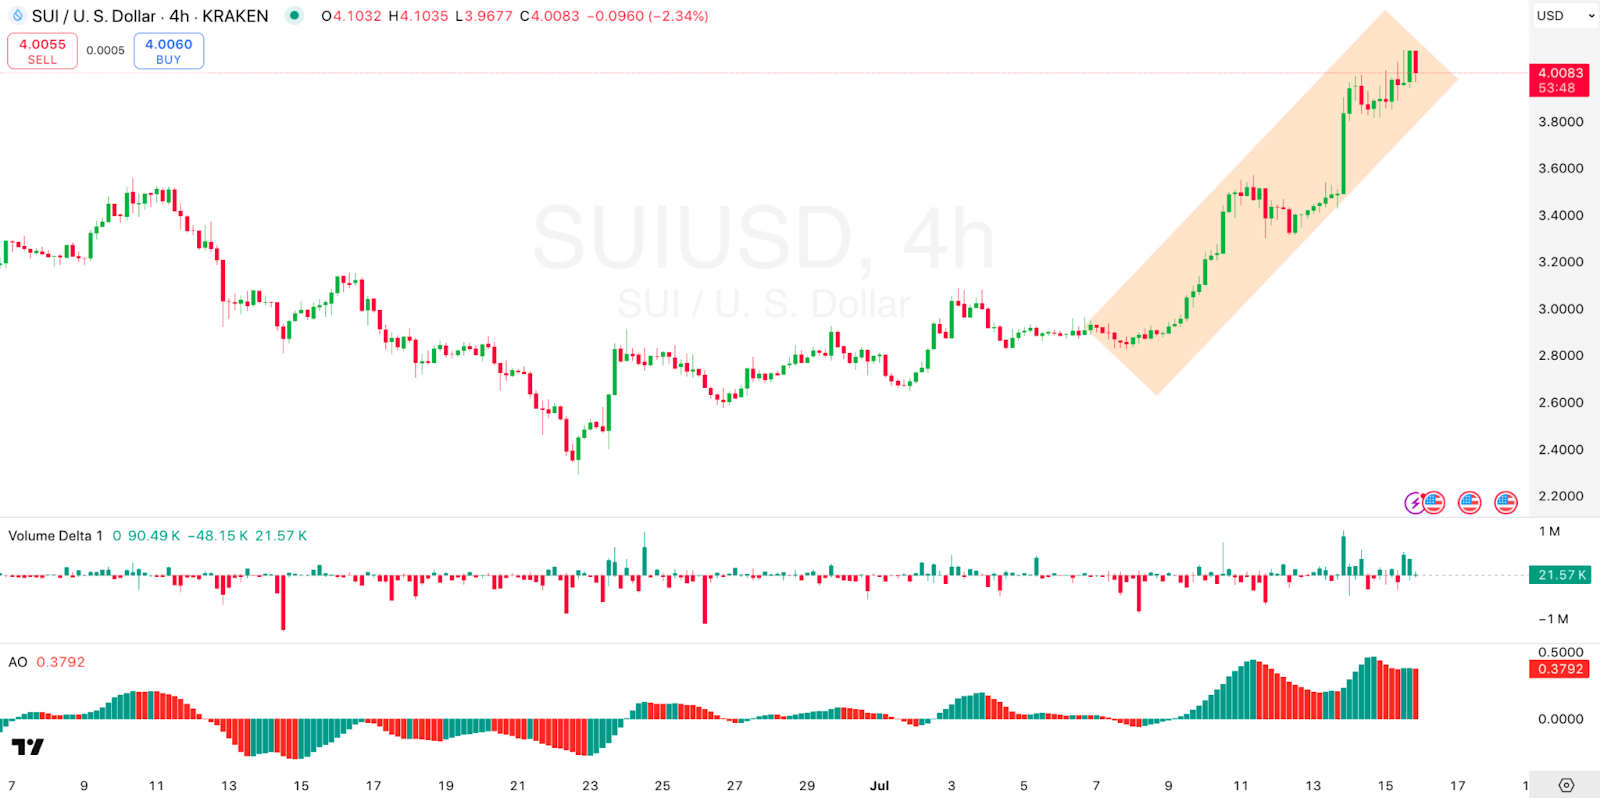
The Sui price has not closed below crucial moving averages. Few signs of bearish divergence in momentum indicators are also not noticeable. The AO is struggling to stay in the positive region. This reflects that in the short-term, the bulls are still in charge.
If the volume stays the same, the uptrend will continue until disrupted by a macro shock or liquidity drain.
The general breakdown hints at Solana’s upcoming outperformance by $SUI in the next few weeks.
The bullish divergence and an increasing number of higher lows have preceded this breakout in resistance. Bulls would additionally gain relative strength once the follow-through was seen.
Disclaimer
This article is for informational purposes only and provides no financial, investment, or other advice. The author or any people mentioned in this article are not responsible for any financial loss that may occur from investing in or trading. Please do your research before making any financial decisions.





