
 NEAR Protocol
 Pearl
Pearl Bitcoin
 Puffer
 ZKsync
 Pudgy Penguins
 Hyperliquid

Key Insights:
- Solana price broke key resistance at $175–$185 and now eyes the $200–$280 range.
- SOL weekly double bottom projected $211.54 if the neckline at $189 confirms the breakout.
- $137.62M in shorts are being liquidated as the price climbs above $180, fueling bullish momentum.
Solana (SOL) price surged past the $175 resistance, sparking renewed bullish sentiment. Analysts are now predicting additional SOL price gains in case the asset successfully turns the range of $175-$185 into a support level. Various indicators and technical patterns suggest a rally to $200-$225 in the next two weeks.
Solana Price Flips Resistance Zone into Potential Support
Solana price is now testing the upper end of the crucial $175–$185 resistance area. This area has been a rejection zone many times in the last year. Analyst Anup Dhungana indicated that a successful flip at this point into support can mark an eventual breakout to higher levels up to $200 or even above it.
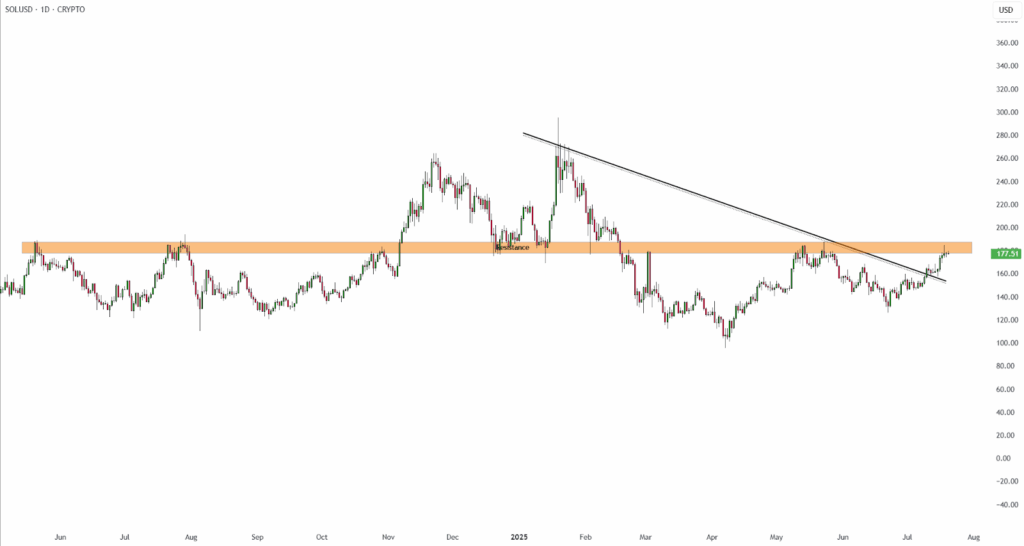
On the daily chart, SOL price broke above a long-term descending trendline and reclaimed horizontal resistance. This was a technical breakout at the current price of $180.98. Historical trends indicate the price can surge rapidly once this range is broken with confidence. A daily close above $185 will further strengthen bullish control and pave the way to $225.
Solana Price Double Bottom Pattern Supports Weekly Breakout
Weekly chart patterns further underscore the bullish argument. Analyst Joe Swanson presented a chart update with a classic double bottom formation at the $120 price, and a neckline at the $189 level. This trend indicated a long-term building-up and possible reversal of trends.
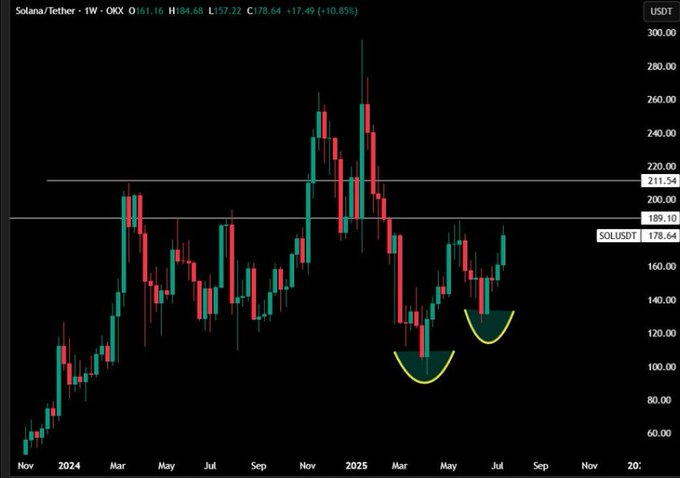
If Solana price breaks above $189, the measured move from the neckline suggests a potential rally to $211.54. The Weekly candles have sustained above the $140-$145 support zone, making this formation stand firm. The daily and weekly bullish formations form a great multi-timeframe strength to sustain upside.
Short Liquidations at $180 Amplify Price Surge
On-chain derivatives data also showed that a large short squeeze might be underway. Analyst CW noted that $137.62 million in short positions would be liquidated if SOL price reaches $180. With Solana‘s price already at $180.98, these positions are likely to be unwound in real time.
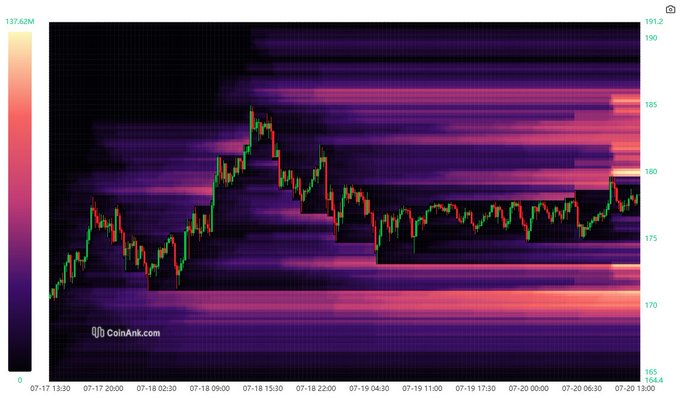
Such a liquidation feature explosive upward reversals as short sellers get squeezed into reversing their short positions. It generates short-term demand surges that push the SOL price to move above resistance levels. The liquidation heatmap revealed a concentration around the short pressure of the levels between $178 and $185, which implied that bulls might easily recover higher ground.
In the meantime, the long/short ratio also pointed to bullishness. According to Coinglass data, trader volume is 65.9% long and 34.1% short. The ratio increased to 1.9326, which is the highest daily.
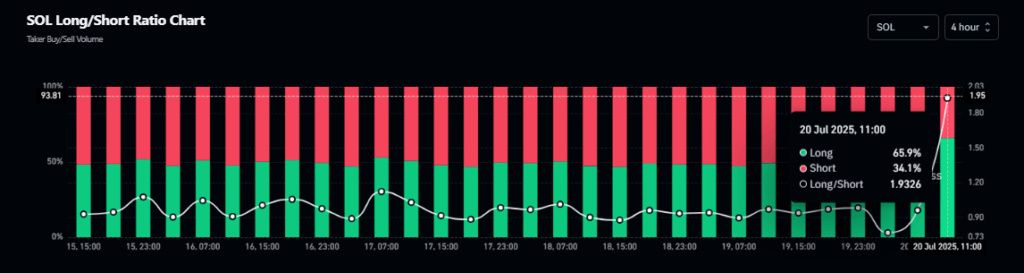
Such an increasing bullish bias was based on an expectation regarding the breakout pattern and Solana price targets.
Weekly Channel Breakout Targets $280 Post-$190 Flip
Additionally, Satoshi Flipper analyzed Solana’s weekly Heikin Ashi candles. He observed a descending wedge breakout and a short-term bull flag. He was projecting the $190 level to be a last obstacle before an explosive rally to the $280 level.
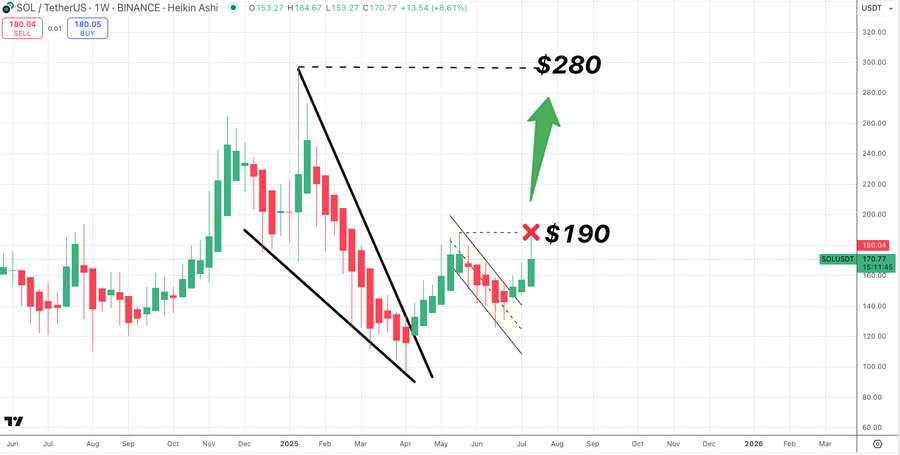
The explanation rests on historic momentum areas, where no resistance enables steep vertical movements between $190 and $280. If Solana price closes above $190 in the coming sessions, the projected path becomes increasingly likely.
This aligned with the breakout structure of the double bottom formation and the daily flip of $175-$185. This technical convergence enhances the chance of extension, and an average of $225-$280 is a viable mid-term estimate should the circumstances persist to be good.
Meanwhile, according to CoinMarketCap data, Solana price gained 11.51% over the past seven days. SOL is currently trading at $180 from a low of $162.21 witnessed on July 14. The market capitalization now stands at $97.35 billion.



