
 astronaut
 Pearl
Pearl Zylo Ecosystem
 Bitcoin
 Bitway
 NEAR Protocol
 Zcash
Zcash

Ethereum price remained in a tight range on Friday, July 25, as Bitcoin and other altcoins dived. The ETH coin could be on the verge of more gains after forming a highly bullish pattern, and as exchange-traded funds (ETFs) broke a key record. It was trading at $3,715, a few points below this month’s high.
Ethereum Price Weekly Chart Points to a Breakout
The weekly chart shows that the Ethereum price began its current rebound in April, when it fell to a multi-month low of $1,374. It formed a doji candlestick pattern, which marked its reversal.
This pattern features a small body and long upper and lower shadows. It means that it opened and closed at the same price.
ETH price then formed a highly common bullish reversal pattern known as an inverse head-and-shoulders. In this case, the head was at $1,375, while the right and left shoulders were at $2,145. The neckline of this pattern is at $4,085, where it failed to move above in March, May, and December last year.
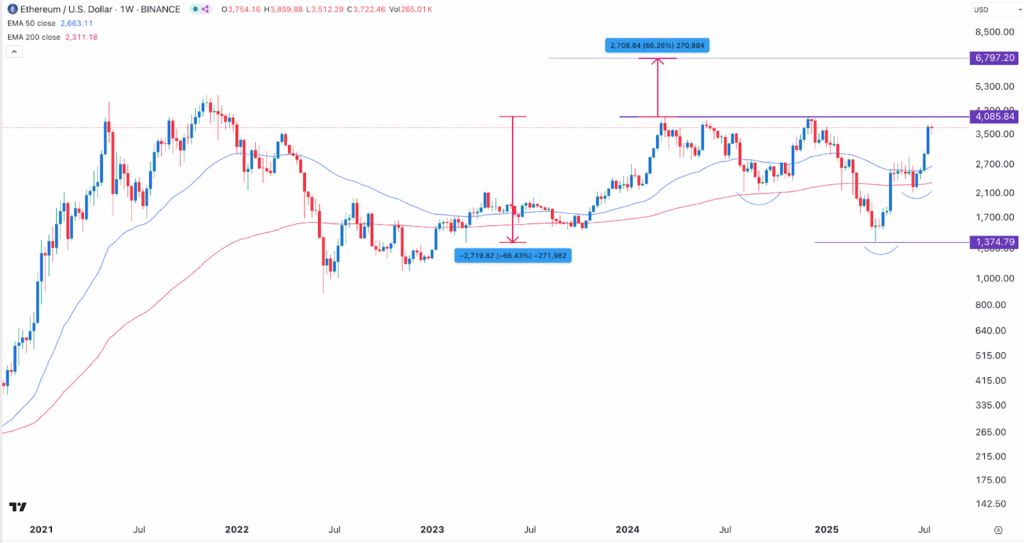
This pattern has a depth of about 66%. Therefore, measuring the same distance from the pattern’s neckline gives the potential target price at $6,797 or ~$6,800. It is about 82% above the current level.
Ethereum Price Daily Chart Confirms the Potential Breakout
The daily timeframe chart also confirms a potential bullish breakout. First, the coin formed a golden cross pattern on July 9 this year as the 50-day and 200-day moving averages crossed each other.
The golden cross happened on the same day when ETH completed the formation of a bullish flag pattern.
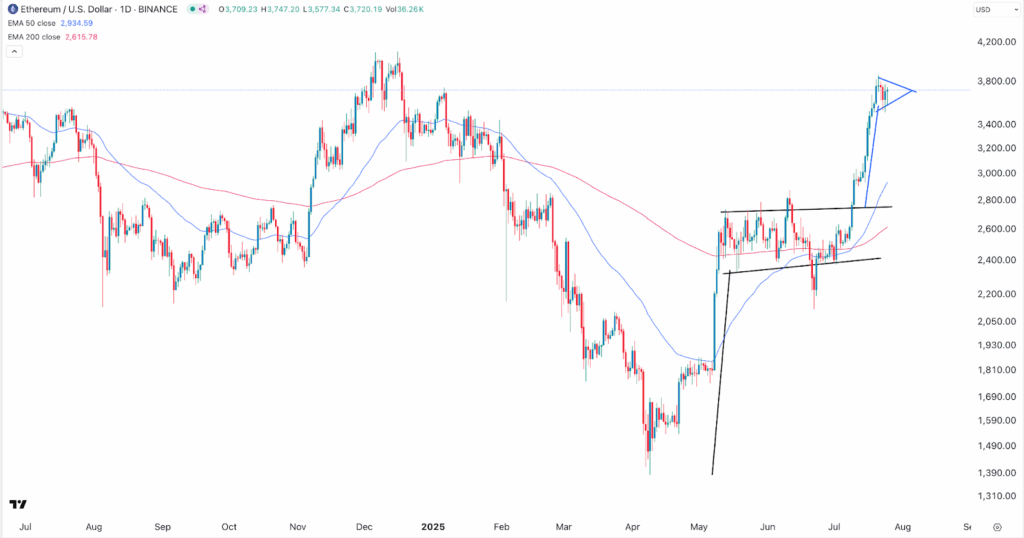
Ethereum price is now forming a new bullish pennant pattern, which is characterized by a tall vertical line resembling a flagpole and a symmetrical triangle. This pattern points to more gains once the consolidation phase ends.
Ethereum ETF Inflows Have Broken a Personal Record
The main bullish catalyst for Ethereum price is the ongoing accumulation by American institutional investors. According to SoSoValue data, Ethereum ETFs have attracted over $1.39 billion in inflows this week.
While this is a big decline from last week’s $2.18 billion, it marks the eleventh consecutive week that these investors have bought these funds.
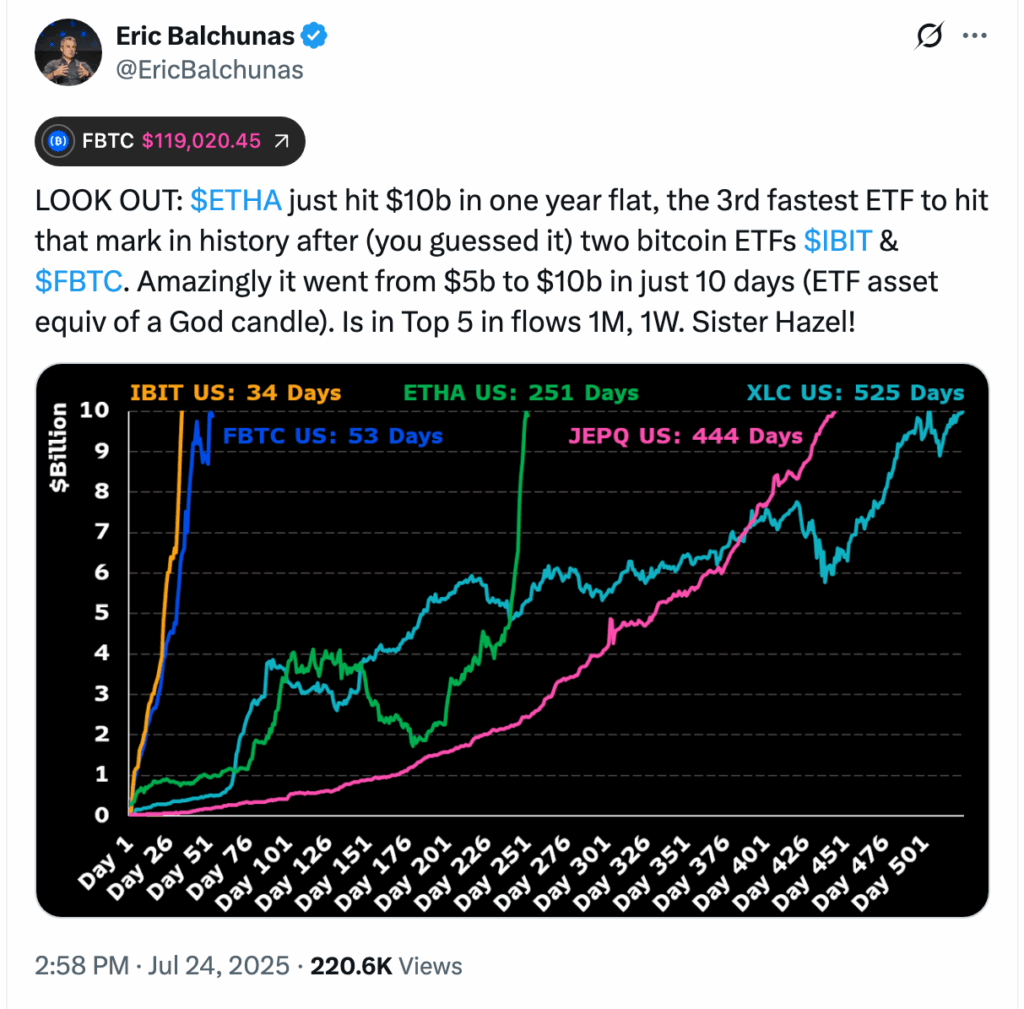
The funds have had a cumulative inflow of $8.8 billion, and their combined assets are $20.7 billion. BlackRock’s ETHA ETF has led the charge and now holds over $10 billion in assets. That makes it the third-fastest-growing fund to reach that milestone, after BlackRock’s IBIT and Fidelity’s FBTC.
Wall Street investors are likely buying Ethereum ETFs because of its dominance across all sectors in the crypto industry. For example, Ethereum is the biggest player in decentralized finance (DeFi) by far. It has a total value locked of over $181 billion, giving it a dominance of 62%.
Similarly, Ethereum is the biggest chain in the stablecoin industry, meaning that it will benefit from the recently signed GENIUS Act. It has over $132 billion in stablecoin asset, and its transaction volume is rising.
More data shows that it is the dominant player in the NFT space as sales jumped by 55% in the last 30 days to over $297 million. Polygon, the second-biggest player, handled over $77 million in sales.
Summary
Ethereum price has surged by over 140% from its lowest level this year. While the remarkable rally has stalled, its strong technicals suggest that the rally has more room to run. It has formed an inverse head-and-shoulders pattern on the weekly chart and a bullish pennant on the daily.
At the same time, institutional investors are accelerating their ETF purchases. Ethereum has also grown its market share in areas like DeFi, Real-World Asset tokenization, and NFTs.




