
 Bitcoin
 Aerodrome Finance
 Zerebro
 Starknet
 Zama
Zama Pearl
Pearl ZKsync

Key Insights:
- Cardano price increased by 4.86% in the last 24 hours, reaching $0.8303.
- A significant whale transaction of 70,131,890 ADA to Coinbase could indicate potential market volatility.
- Cardano’s technical indicators show bullish trends, with key support levels at $0.78 and resistance at $0.85.
Cardano price recently experienced a significant price bump, expanding by approximately 4.86% over the past 24 hours. This comes amid a recent whale move.
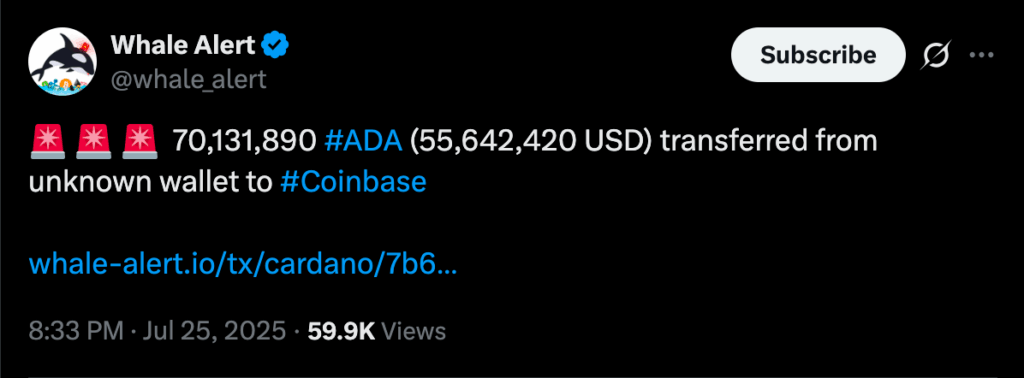
It saw a transaction of 70,131,890 $ADA transferred from an unidentified wallet to Coinbase. Those ADA tokens were valued at roughly $55.64 Million.
According to recent data, the Cadano price may be interpreted as an indication of the diminished activity of the market. This is despite the decline in recent volumes.
A large transfer of 70,131,890 ADA to Coinbase triggered investor attention. This movement influenced $ADA as the market reacted to the potential implications of such a significant shift in holdings.
ADA is, however, resilient in terms of price even faced with this transfer. This element of confidence among its investors may propel its price further upwards.
Cardano Price Charts Indicate Massive Up-trend
Cardano price data shows constant and uniform upward movement in recent days. The new uptrend has pushed ADA to the present price of $0.8303 from about $0.78. $ADA is facing resistance at $0.85. The level has been a tough nut in the previous instances.
There can be an upward move if the Cardano price can overcome this level. On the chart, we can also see that $ADA has received strong support at $0.78.
Based on this, the current development of the Cardano price could be an early sign of a greater bullish market. That could be seen if the level manages to hold.
Cardano Liquidations: The Whale Effect
Liquidity has also been variable in the Cardano market, with sharp increases in the liquidation volume. This was especially true when the Cardano price fluctuations started.
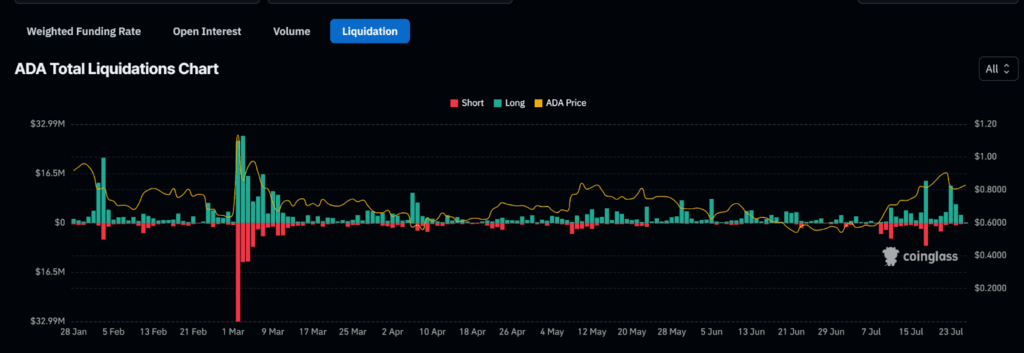
The total liquidation chart of ADA indicates strong jumps in short and long liquidations. Those larger jumps are related to the times of sharp price changes.
Following a steep increase in the price of Cardano in mid-July, a consequent liquidity move prompted even more liquidations. Both were in the long and short units.
This sharp increase in liquidations can be taken as a sign of volatility. Due to this, the Cardano price could experience new swings in the near term.
Nevertheless, despite the liquidations, $ADA has continued to demonstrate a powerful price level. This points to its ability to survive and the power of its existing market.
Cardano Price Movement Forms a Double Bottom
Looking at 1-Day Cardano price charts, we see a double-bottom. The support potential of the indicator is represented by the levels of $0.65 and $ 0.68.
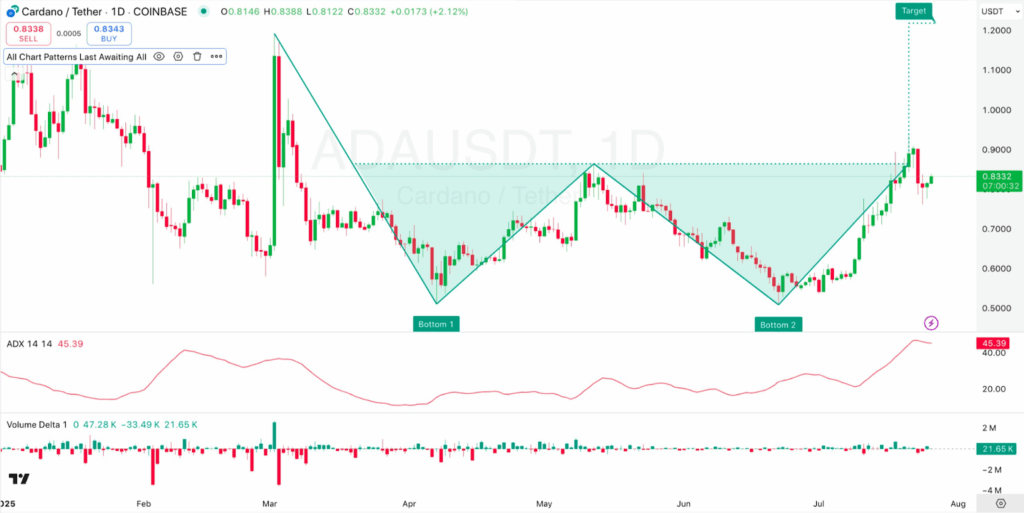
Besides, the ADX (Average Directional Index) is at 45.39. This indicates that the market follows a strong trend that aligns with the bullish outlook.
The 24-hour volume analysis shows that people are increasingly interested in ADA. The large buying volume could be responsible for the upward price trend.
Cardano price is forming higher lows and breaking resistance levels, which shows growing bullish momentum. Combined with the recent ADA transfer, these signs suggest a potential price increase in the coming weeks.
Disclaimer
This article is for informational purposes only and provides no financial, investment, or other advice. The author or any people mentioned in this article are not responsible for any financial loss that may occur from investing in or trading. Please do your research before making any financial decisions.




