Zylo Ecosystem
 Walrus
 Pudgy Penguins
 Pearl
Pearl Bitcoin
 Aerodrome Finance
 Quantus

Key Insights:
- Bitcoin price holds $112K support after weekend drop from $118K.
- August historically delivers losses; 11.4% average BTC decline.
- Bulls eye $118K, but $125K monthly resistance remains strong.
Bitcoin price bounced back to $114,000 on Aug. 4 after falling to $112,300 during the weekend. The pullback followed weak U.S. jobs data on Friday and new tariff threats that rattled global markets. BTC traded as high as $118,330 before reversing sharply on Saturday, with traders locking in profits amid thin weekend volume. The retreat tested former all-time high support at $112,000, which held despite brief intraday dips. That level aligned with the 50-day moving average, attracting bids near the close.
Bitcoin Price Rejected At $115K Level
BTC failed to push above $115,000 despite multiple intraday attempts on Saturday and early Sunday. Captain Faibik posted on X that “$BTC bulls failed to reclaim $115K, with $118K as the next target.” He added that the four-hour chart showed a falling resistance trendline capping upside attempts for the past two weeks.
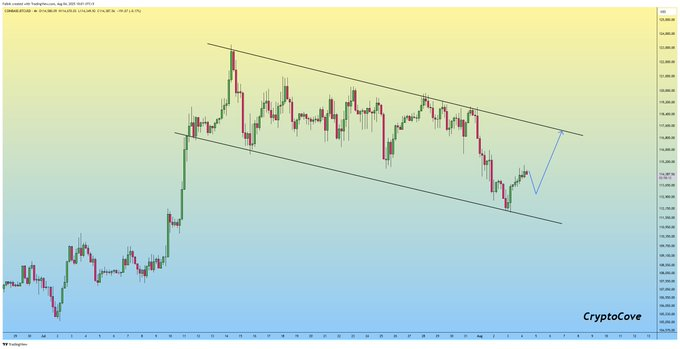
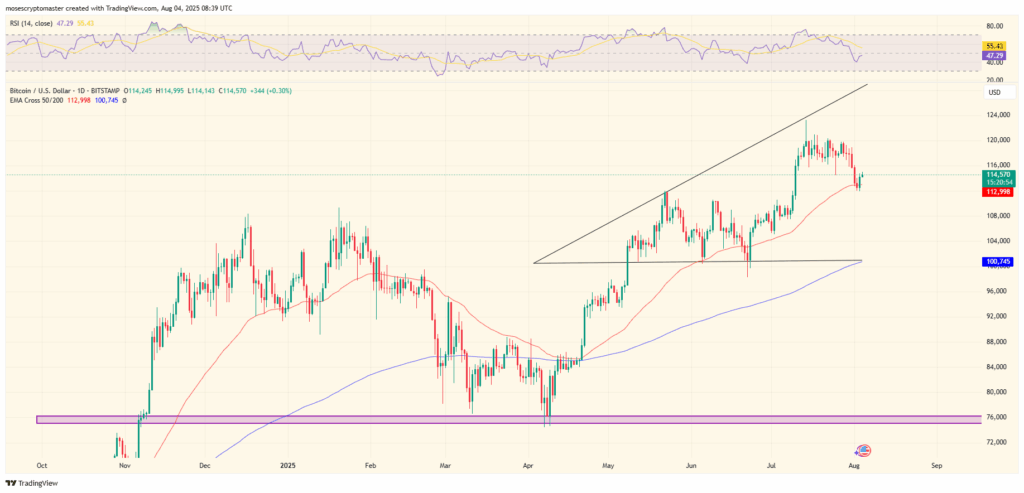
TradingView data confirmed that Bitcoin price printed lower highs throughout the weekend, forming a descending channel from the July peak. Price action respected the lower boundary at $112,000, where buyers stepped in. The RSI on the daily chart hovered around 46.20, showing momentum had cooled but was not oversold. The 50-day EMA at $112,986 supported the intraday recovery.
CoinGlass liquidation data showed that $32.8 million in shorts were flushed during the Monday morning bounce. Longs saw nearly $29 million wiped out during Saturday’s decline, as per the same dataset. Open interest dropped by 4.3 percent from Friday to Sunday.
After Friday’s payroll report, IG Markets strategist Tony Sycamore said Bitcoin pulled back in line with broader equities. “Risk assets lost ground as the labor market weakened and tariff concerns resurfaced,” he said. Sycamore noted that $112,000 aligned with the March all-time high, which made it a “logical place for dip buyers to show up.”
August Selling Mirrors 2022 Pattern
Historically, August has been one of Bitcoin’s worst-performing months. Since 2013, BTC closed August in the red eight times out of twelve. Data from Glassnode placed the average monthly loss at 11.4 percent. If the pattern repeated this year, that would translate to a projected pullback toward $105,000.
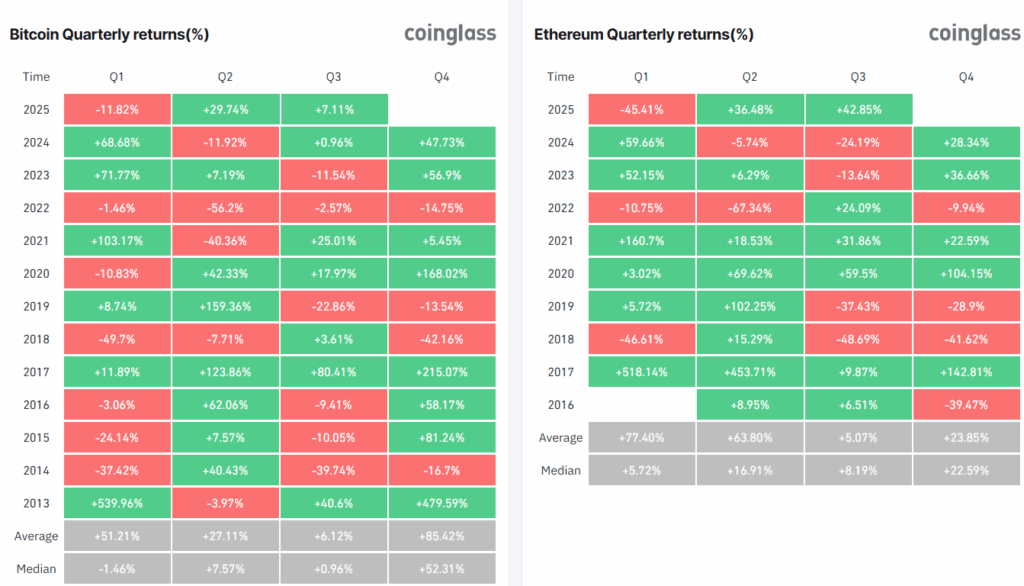
In 2022, Bitcoin dropped 14.3 percent in August, ending the month near $19,800. A year later, BTC fell another 10.4 percent, closing just above $27,300. These declines coincided with rising Treasury yields and hawkish Federal Reserve policy. In 2024, Bitcoin lost 8.6 percent in August, retracing to $59,000 before rebounding in September.
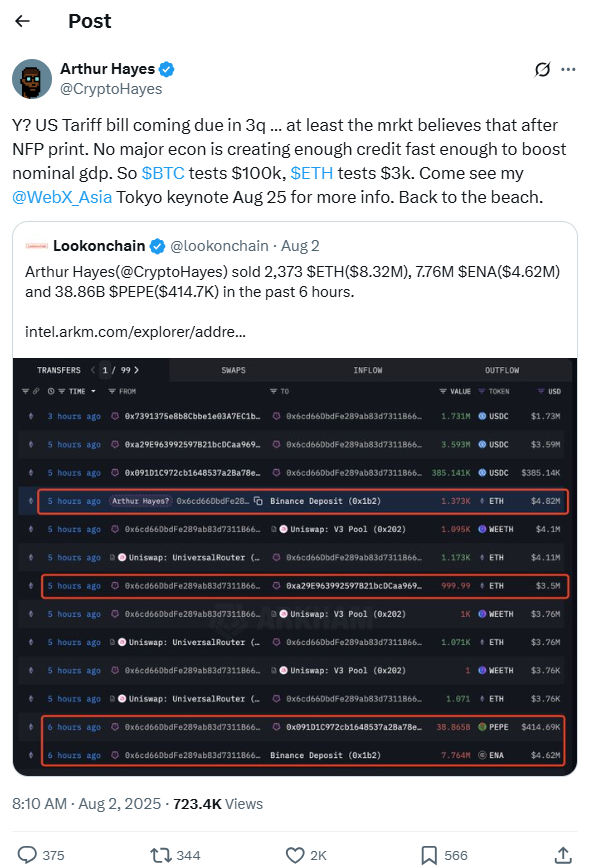
In a blog post on Sunday, Arthur Hayes warned that macroeconomic tightening and dollar strength could drag BTC lower. He wrote, “$100,000 remains a critical psychological level if volatility spikes again.”
CryptoQuant noted that exchange reserves dropped by 12,400 BTC last week. The decline hinted that whales and long-term holders were moving coins off exchanges, possibly into cold wallets. The firm’s stablecoin ratio also fell, suggesting lower buying pressure from sidelined capital.
Funding rates on BTC perpetual futures turned negative across multiple exchanges. CoinGlass data showed that traders paid to hold short positions throughout the weekend. That trend reversed slightly on Monday as Bitcoin price reclaimed $114,000.
Bitcoin Price Key Resistance Sits Just Below $125K
Bitcoin now faced a tight resistance band between $115,000 and $118,330, with monthly resistance at $125,000 looming above. Sycamore said the $125,000 mark matched a previous monthly closing high and could act as a barrier without a new macro driver.
Coinbase premium index showed neutral flows, with no signs of institutional accumulation. Spot volume remained thin across major exchanges, indicating that retail traders dominated the bounce. IntoTheBlock data showed that over 730,000 wallets acquired BTC between $110,000 and $113,500, creating a strong on-chain support zone.
IncomeSharks, a popular trader on X, wrote that “bears had their fun over the weekend,” but added that bulls should wait for a clean reclaim of $115,000 before celebrating. He described the current structure as “choppy, but technically intact.”
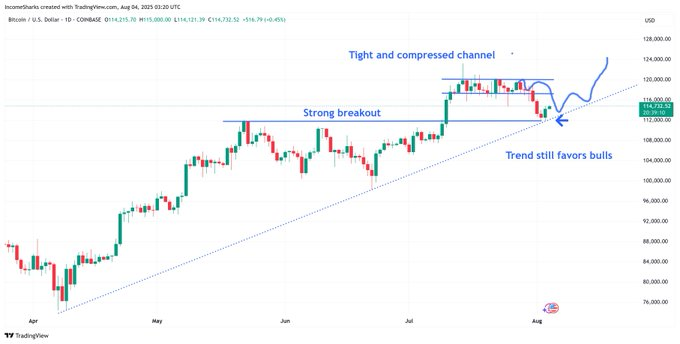
If Bitcoin price failed to hold above the $110,000 threshold, the next key level stood at the 200-day EMA, now near $100,742. That level coincided with the round-number psychological support at $100,000, which Hayes flagged in his warning note.
Volatility Ahead As BTC Holds Support
Bitcoin cautiously entered August after a sharp weekend reversal and mounting macroeconomic pressure. The price held the $112,000–$114,000 range into early Monday, confirming it remained in a broader consolidation phase. Traders looked for a breakout above $115,000 to challenge the $118,000 resistance from July.
Analysts said the outlook would depend on risk sentiment and fresh data from the U.S. economy. The next CPI report, due Aug. 13, could set the tone for equities and crypto alike. Until then, BTC appeared range-bound between key levels.