
 Pearl
Pearl Bitway
 Pudgy Penguins
 Quantus
 Walrus
 Quant
Quant Artificial Superintelligence Alliance
Key Insights:
- HBAR appears to be forming multiple bearish patterns and is poised for downside momentum.
- Traders’ bets on short positions skyrocket, showing strong bearish sentiment among the traders.
- $13.21 million worth of HBAR tokens have been flowing out of exchanges, hinting at potential accumulation.
With a 10% price dip, Hedera (HBAR) appears to be forming bearish price action and is poised to continue downside momentum. The potential reason for this bearish outlook is the overall market sentiment and traders’ strong bearish bets.
HBAR Price and Traders Bearish Bets
HBAR has been trading near $0.2477 and has slipped 7% in the past 24 hours. This downside momentum in the asset has garnered massive attention from investors and traders, leading to a 40% surge in the trading volume recorded.
This surge in the trading volume while the price dips indicates strong downside momentum in the asset, and it’s a bearish sign for the token holders.
On-chain analytics tool Coinglass hints that traders have been strongly betting on the bearish side. At press, the major liquidation levels are $0.254 on the lower side and $0.2717 on the upper side, where traders are over-leveraged.
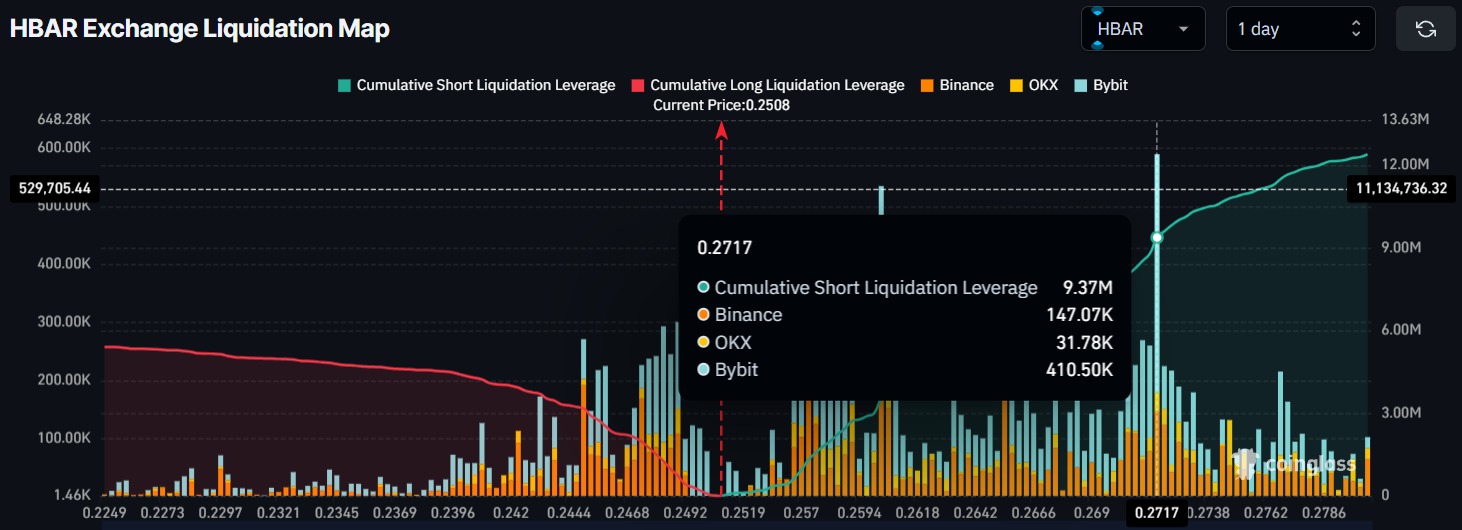
At these levels, they have built $3.14 million worth of long positions and $9.37 million worth of short positions. Which makes clear traders’ sentiment, which is bearish.
HBAR Price Action and Key Levels to Watch
This strong bearish bet has turned the price action negative. According to expert technical analysis, HBAR appears bearish as it forms multiple bearish patterns on the daily chart.
The chart shows that HBAR has already formed inverted flag-and-pole patterns. And is currently developing a bearish head-and-shoulders pattern, which is yet to be completed.
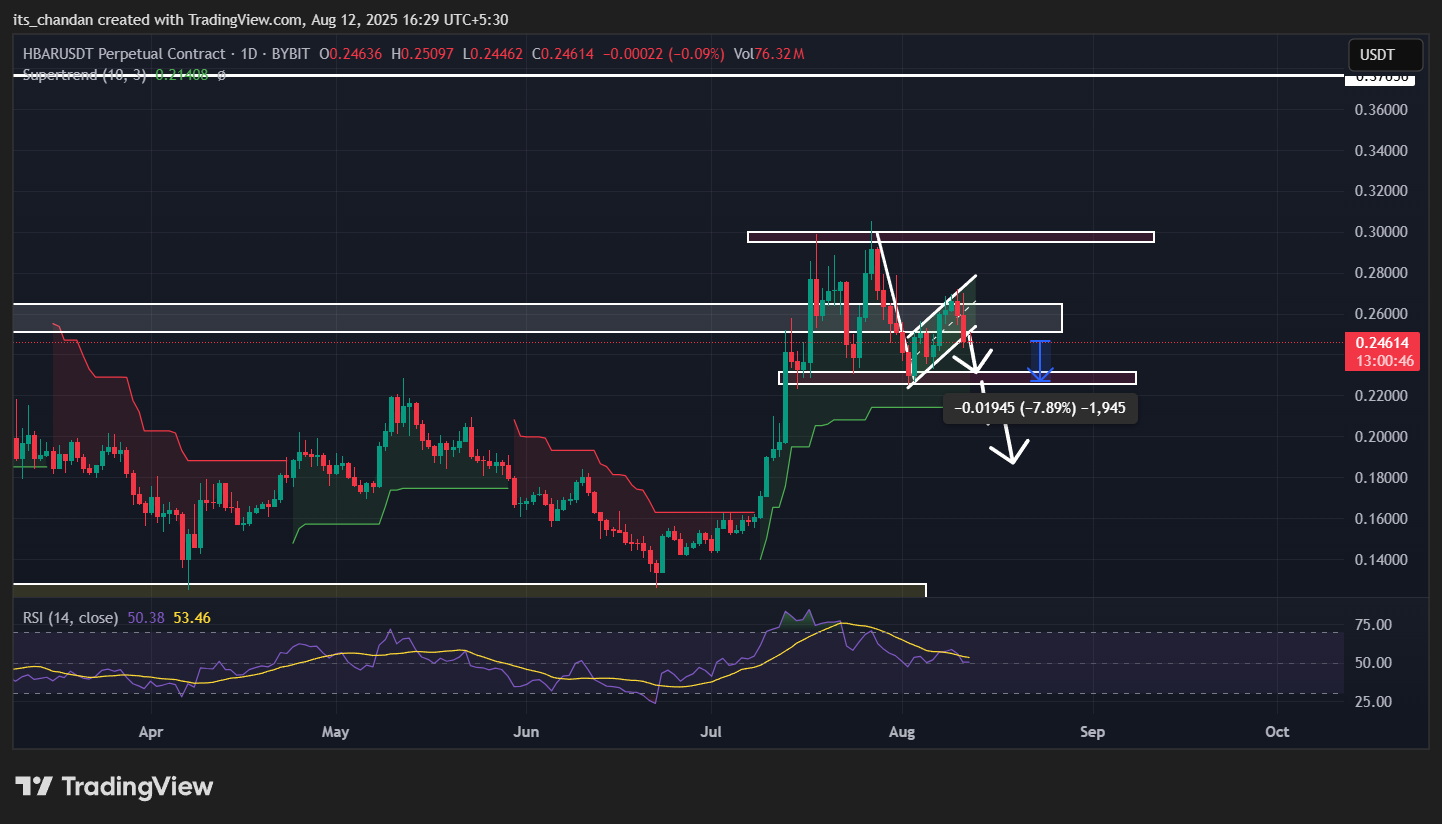
Based on recent price action, the asset has broken out of an inverted flat. Suggesting it is poised for an 8% dip, with the neckline providing key support at $0.22.
If this downside momentum continues and HBAR price breaks below this level, the asset could fall even lower.
The head-and-shoulders price action pattern will only be activated. If the HBAR price falls below $0.22; otherwise, it will be invalidated and have no impact on the asset.
Technical Indicator Insights
Despite the formation and activation of bearish patterns, the technical indicator Supertrend still flashes a bullish signal.
On the daily chart, it is in green and below the HBAR price. Suggesting that the asset is in an uptrend and bulls dominate.
In the meantime, the Relative Strength Index (RSI) is in the neutral zone. Indicating that HBAR is neither overbought nor oversold. In this condition, the asset’s momentum depends on investors’ and traders’ buying activity, which currently appears to be mixed.
Given the current market sentiment, investors and long-term holders have accumulated the token as the asset price continues to fall.
$11.2 Million Worth of HBAR Outflow From Exchanges
Data from Coinglass reveals that exchanges over the past 48 hours. Have recorded an outflow of $11.2 million worth of HBAR tokens.
This substantial outflow from the exchanges hints at ongoing accumulation and has the potential to lower selling pressure.
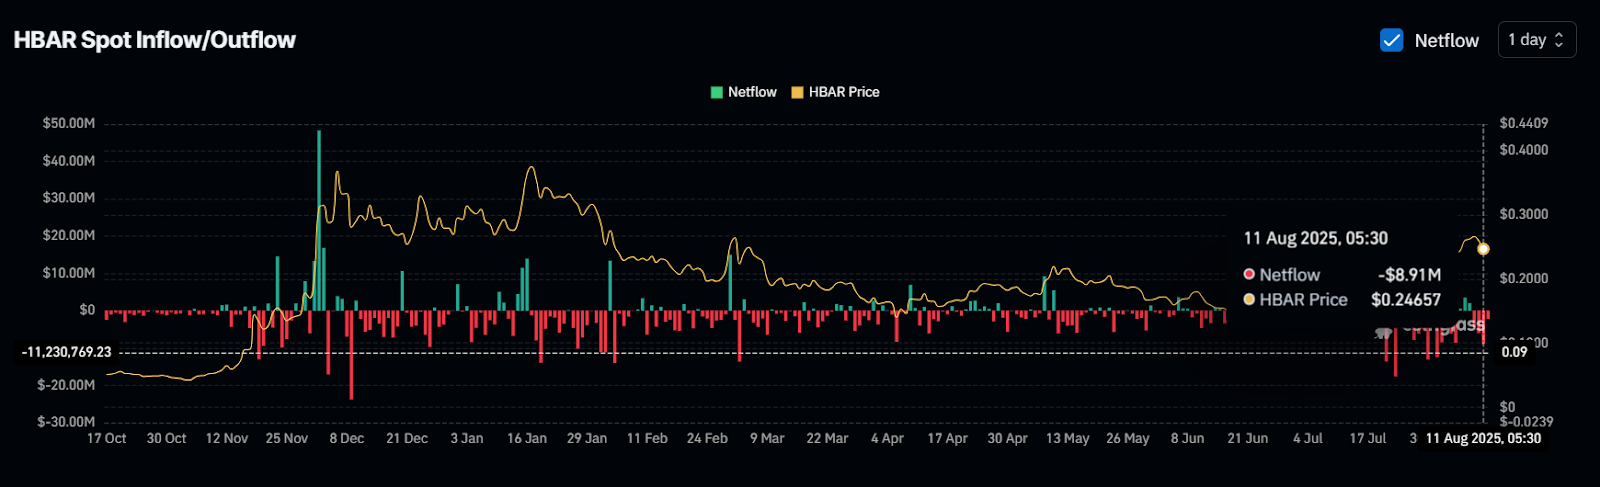
When combining on-chain metrics with technical analysis, short-term market sentiment is bearish. While the long-term outlook remains bullish, supported by ongoing HBAR outflows.
However, sentiment could turn fully bearish if the asset falls below the $0.22 level. In which case it may either move sideways or remain in consolidation.
Disclaimer
This article is for informational purposes only and provides no financial, investment, or other advice. The author or any people mentioned in this article are not responsible for any financial loss. That may occur from investing in or trading. Please do your research before making any financial decisions.



