
 Bitcoin
 Ondo
Ondo NEAR Protocol
 Walrus
 Pearl
Pearl Pons
Pons Ethereum

The wildly popular IBIT ETF stock price has pulled back in the past week, mirroring the performance of Bitcoin. It has dropped to $66, down by 6.15% from its all-time high. This article uses a Bitcoin price analysis to explain why the iShares Bitcoin Trust stock may be about to crash.
Bitcoin Price Predicts the IBIT ETF Stock Crash
The IBIT ETF is the biggest Bitcoin fund holding assets worth over $87 billion and commanding a 58% market share. Like other spot Bitcoin ETFs, it is designed to track the price of BTC, making it easier for institutional investors to allocate capital in the asset without worrying about keys.
Therefore, one approach for forecasting the IBIT stock price performance is to look at Bitcoin. The chart below shows that the Bitcoin price bottomed at $15,487 in late 2022, following the collapse of FTX.
It then embarked on a strong bull run, rising by 650% to the current $115,635. However, there is a risk that the surge may be about to form a breather as it has formed some highly bearish chart patterns.
The most important pattern is a rising wedge chart pattern, which is comprised of two ascending and converging trendlines. This pattern has been forming since March last year, and the two lines are now nearing their meeting point.
The price target in this pattern is estimated by first measuring the height at its widest part. In this case, this height is about 45%. Measuring the same distance from the confluence level gives the Bitcoin price target to $62,087.
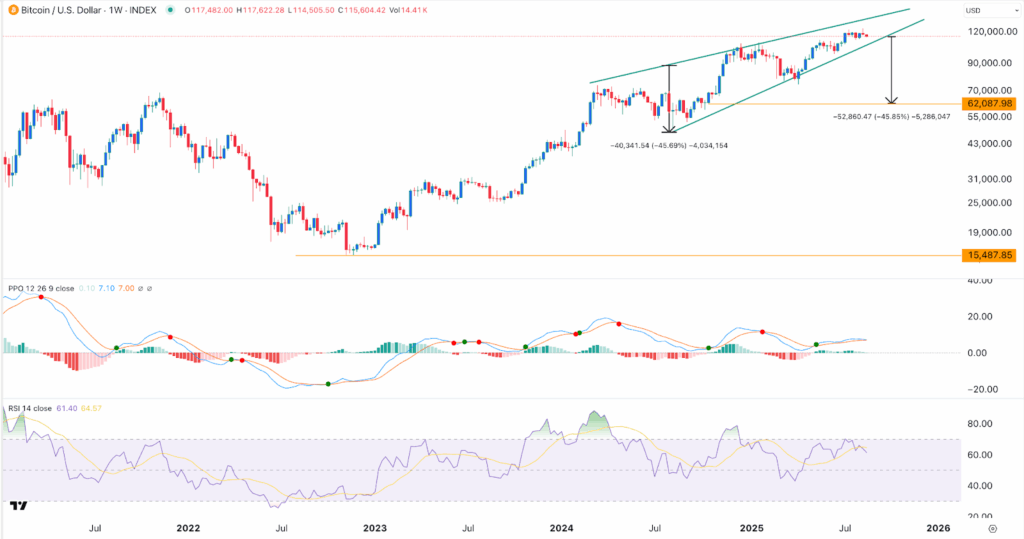
Bitcoin price has formed other highly bearish chart patterns. The most notable one is a bearish divergence, which forms when oscillators move downwards. The Relative Strength Index (RSI) and the MACD have formed descending channels.
These patterns confirm potential downward breakout, impacting the IBIT ETF stock.
IBIT ETF Stock Forms a Double-Top Pattern
Meanwhile, the IBIT ETF stock price has also formed bearish chart patterns on the daily timeframe. This chart shows that the fund has formed a double-top pattern at $69.45. This pattern is characterized by two distinct peaks and a neckline, which, in this case, is at $63.97, its lowest level this month.
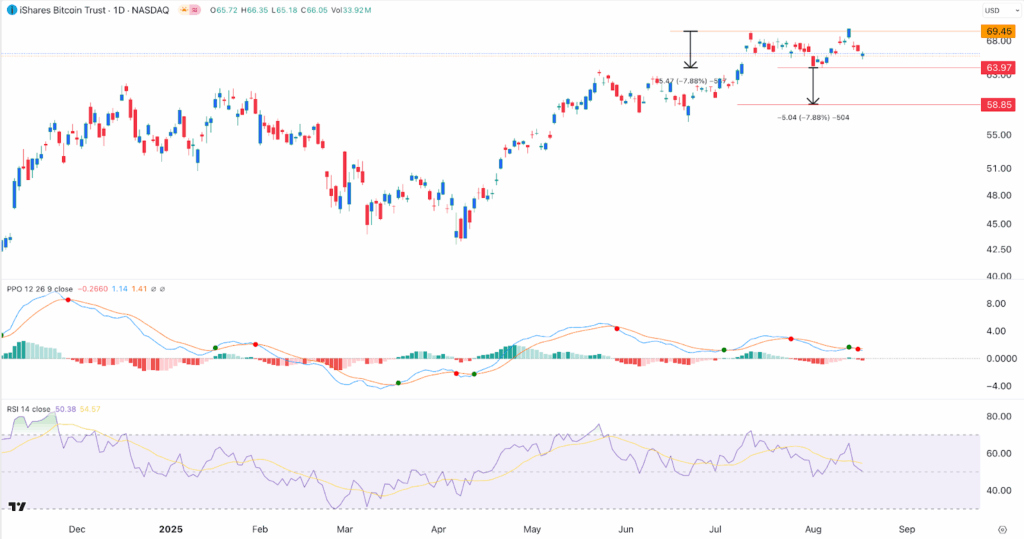
The profit target in a double-top pattern is found by measuring the depth, which, in this case, is 7.88%. One then measures the same distance from the neckline gives a short-term target at $58.85. Also, like Bitcoin’s weekly chart, the IBIT has also formed a bearish divergence chart pattern.
FOMC Minutes and Jackson Hole Symposium as a Bearish Catalyst
A potential bearish catalyst for the IBIT ETF stock price is the upcoming FOMC minute and Jerome Powell’s speech at the Jackson Hole Symposium in Wyoming.
The FOMC minutes will provide more information about the last monetary policy meeting in which officials left interest rates unchanged with two officials dissenting.
However, the minutes are backward-looking, meaning that their impact will be limited. Instead, investors will focus on Jerome Powell’s statement at the Jackson Hole meeting.
In the past, this meeting was where Federal Reserve officials provided hints on what to expect in the September meeting. This will be important because it comes a week after the US published the latest consumer and producer inflation numbers that were largely higher than expected.
As such, Powell will respond and provide a hint on whether he will cut rates to stimulate job creation or leave them unchanged to fight inflation. A hawkish statement could lead to a bearish breakdown of the IBIT ETF stock and Bitcoin prices.
On the other hand, a confirmation that the Fed will cut interest rates in September, as most analysts expect, will lead to higher Bitcoin and IBIT prices.



