
 Bitcoin
 Aerodrome Finance
 Zerebro
 Starknet
 Zama
Zama Pearl
Pearl ZKsync
Key Insights:
- Solana’s breakout from $205 sets a technical target of $255.
- Increased volume and bullish indicators confirm Solana’s upward price trend.
- Solana’s wedge formation breakout signals a potential rally to $255.
The Solana price has been making major progress as technical analysis and chart patterns indicate that it could rise to $255. Lark Davis says if Solana can close its daily high over the level of $205, it may start accelerating to $255. It is one of the technical levels based on the breakout pattern.
This price objective is correlated to a key resistance point. It may indicate a fresh bullish drive in the cryptocurrency.
Solana Price Breaks out from the Wedge Formation
SOL price has recently successfully broken out of an ascending wedge formation. This move is often used to signify a bullish reversal.
The breakout indicates that the market is about to make a more powerful move, giving Solana the capacity to break over the $205 resistance mark. It could mean that the asset may be on the path to an even greater price increase.
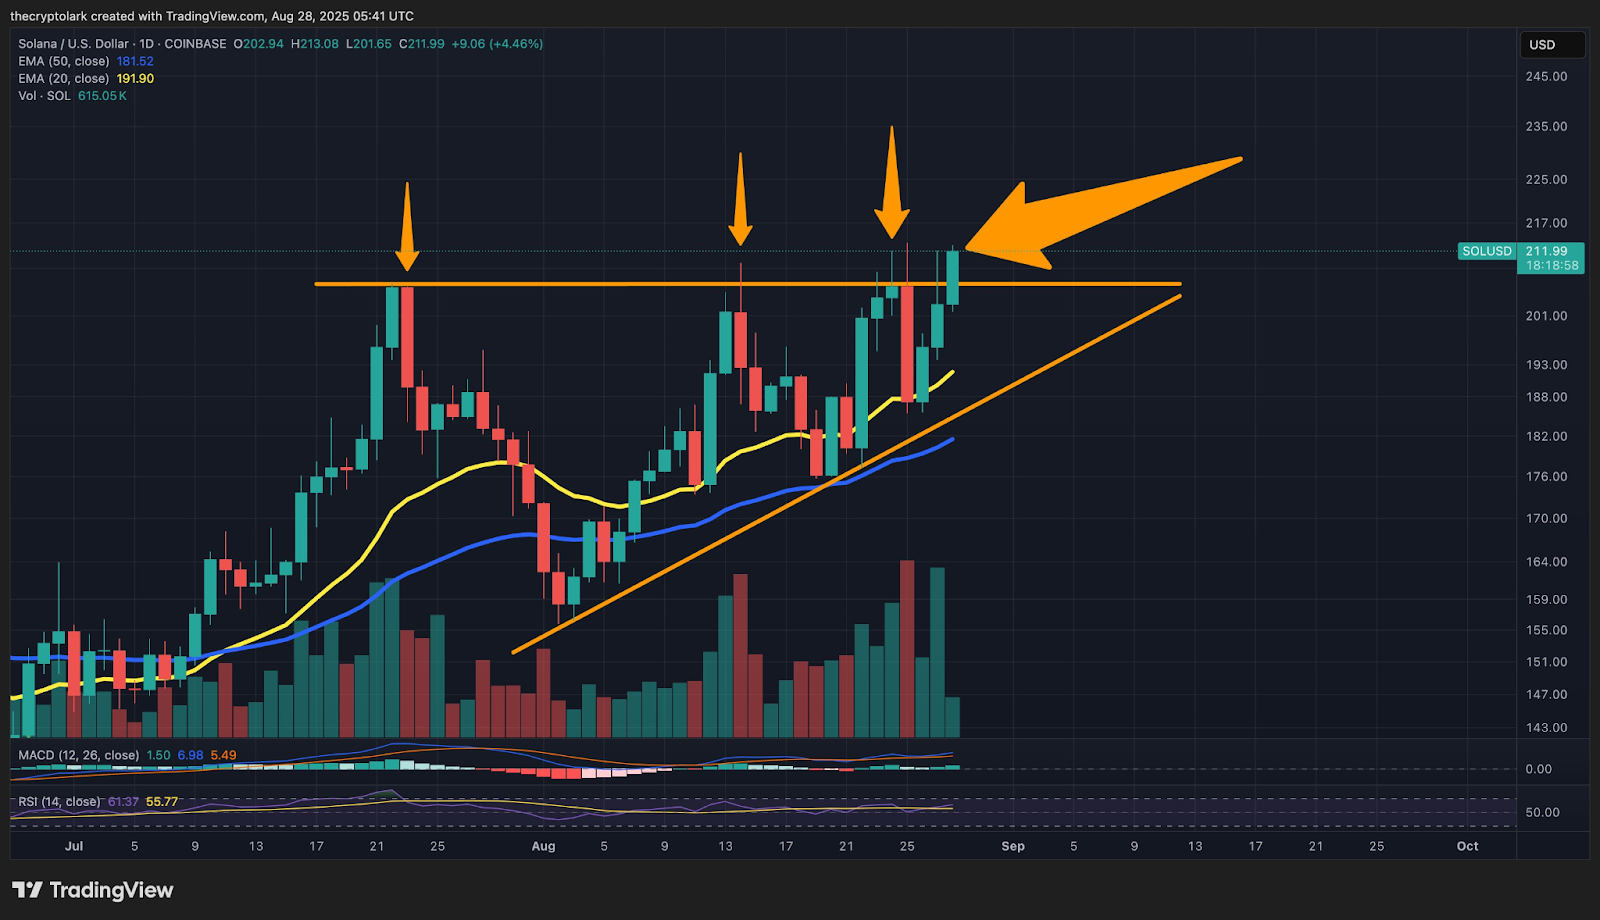
The wedge pattern has served as a unifying trend in the last few weeks, and the price has now broken loose. It may be entering a stage of accelerated Solana price action.
The technical breakout point of this breakout is pegged at $255. It is a point that Solana might soon test when the current momentum is maintained. The escape out of such a wedge formation indicates that the asset is under a great uptrend. More buying pressure can drive the price up.
Solana Price Technical Analysis and Market Outlook
The price of Solana has been in a bullish mood with increased highs and lows since the middle of June. Technical factors are not the only ones that contribute to the upward momentum, as a solid market sentiment plays in favor of the future development of Solana.
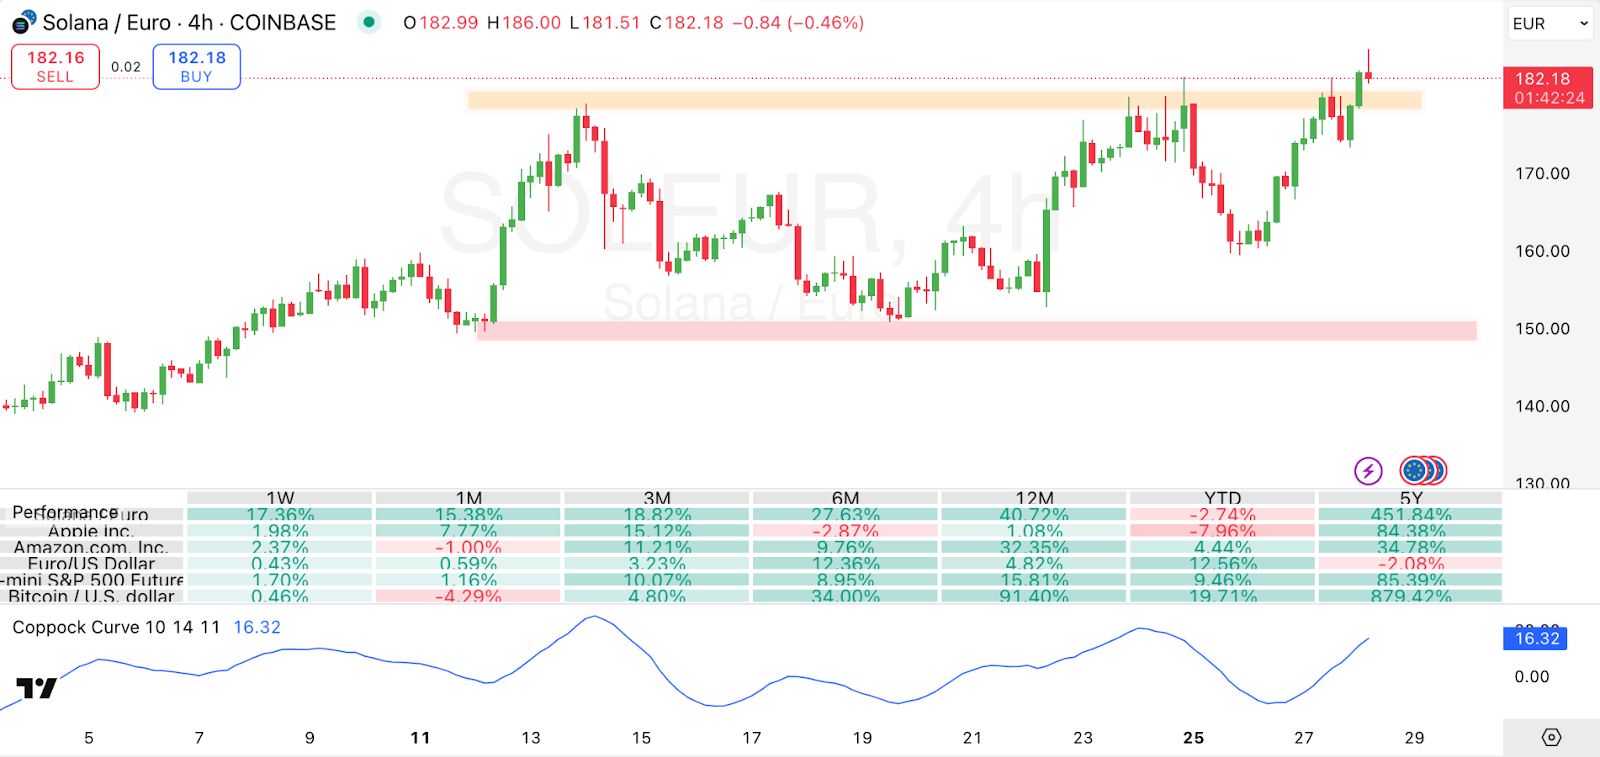
The chart analysis presents the fact that Solana has crossed the $212 (182 Euros) resistance barrier. It is one of the primary levels that the asset struggled with before.
Such a break is above the resistance level, and the volume is increasing, which means that the market is willing to drive Solana up. The $255 Solana price may serve as the technical target for the price breakout. A sustained action in this direction would be a good indicator of sustained bullishness.
Besides these signs, the performance data and Coppock Curve readings also give more evidence to Solana’s bullish case. The possibility of achieving the target of $255 is high as long as the crypto remains superior to the other assets in the market.
Solana’s Liquidations and DEX Volume
Along with positive technical signs, Solana has also experienced a tremendous increase in market activity. The total liquidations chart indicates that liquidations have had a consistent trend in short positions, especially in the past few weeks.
Such liquidations indicate that speculators who bet against Solana have had to pull out, and this contributes to the upward trend. Short positions are sold off. Therefore, the selling pressure increases and the asset moves up.
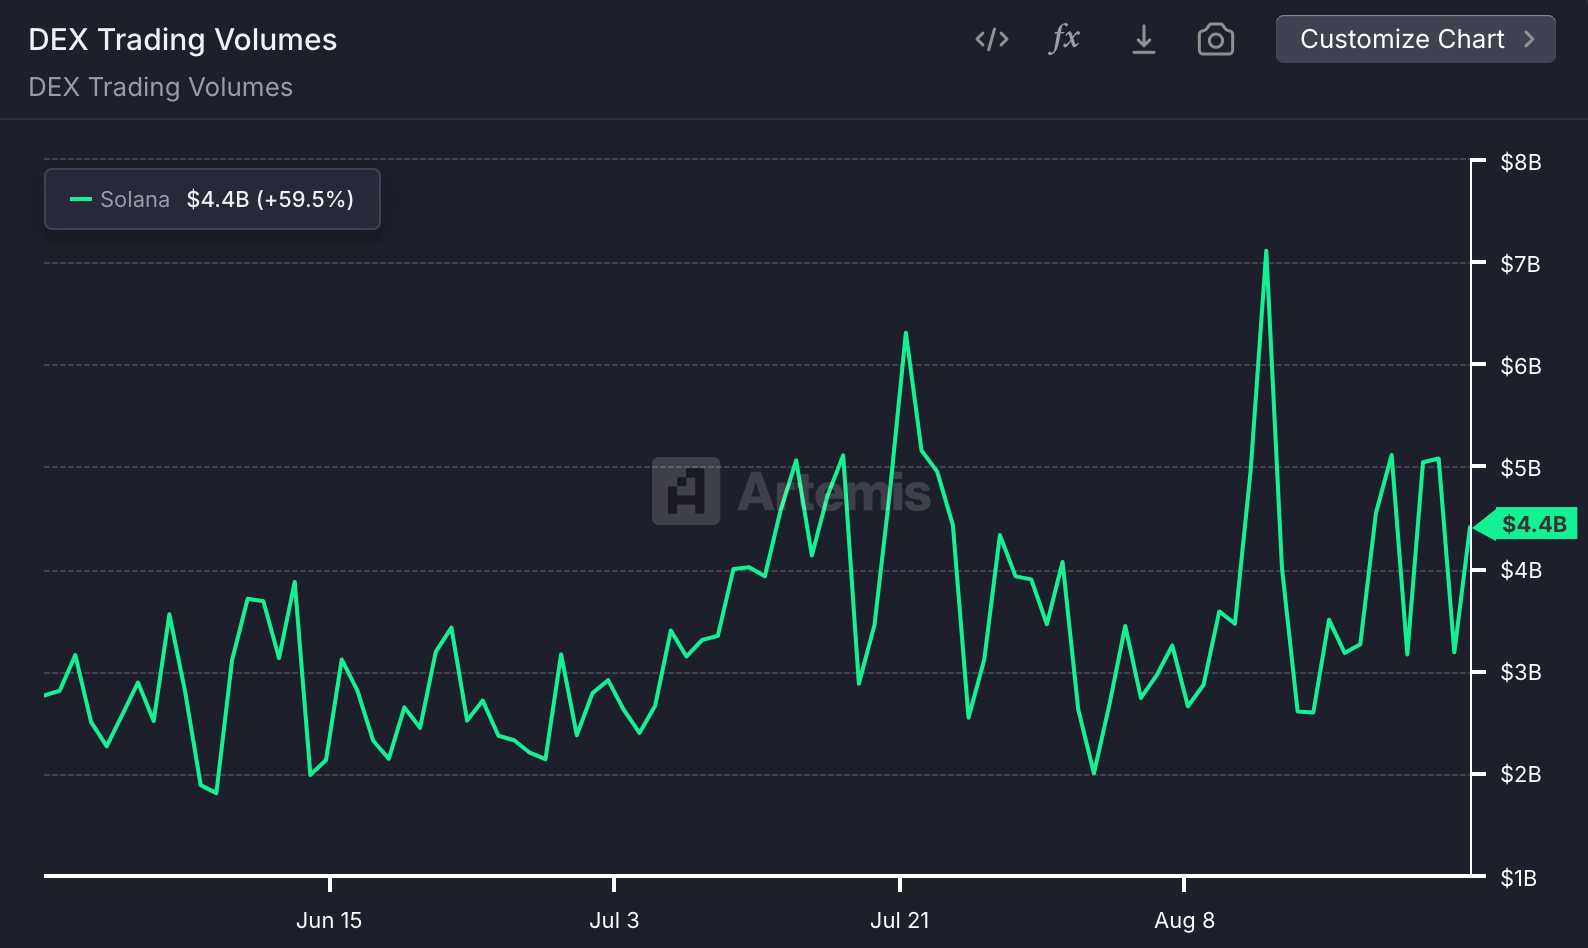
Also, the Solana decentralized exchange (DEX) trading volume has increased significantly, with the total DEX volume reaching up to $4.4 billion, which is a 59.5% point growth.
This increase in trading volume is a good sign for Solana crypto. It signifies good market presence and investor trust.
Increased trading levels can be associated with longstanding price changes. Besides, the volume of Solana grew in its DEX, confirming that the asset can continue to rise in its bullish trend.
Suppose Solana price sustains its recent bullish trend and stays above major support areas, it could experience a major surge over the next few weeks.
Disclaimer
This article is for informational purposes only and provides no financial, investment, or other advice. The author or any people mentioned in this article are not responsible for any financial loss. That may occur from investing in or trading. Please do your research before making any financial decisions.




