
 Pearl
Pearl Walrus
 Starknet
 Quantus
 Bitway
 Sui
Sui Zylo Ecosystem

Key Insights:
- Sui price shows potential bullish trend if it breaks $3.52 resistance.
- Having over 600 billion total token volume indicates increasing ecosystem adoption.
- The falling wedge pattern indicates that the price of $SUI may experience a bullish breakout.
Sui price has been consolidating near the $3.20 support level, signaling potential for a rebound. The asset entered a descending channel after facing resistance in the $3.4–$3.50 zone. Despite recent pullbacks, the price has remained steady, and lower highs are forming, indicating a potential upward breakout. If SUI can break the $3.52 resistance, it may trigger a rally.
The price is testing significant support that, once sustained, may form the basis of a rise. The market volume of SUI stands at 1.09 billion and the company has increased by 5.68% in the past 24 hours. Moreover, the increasing popularity of the SUI ecosystem is also signalled by the total token volume of more than 600 billion.
SUI Surpasses $600 Billion Token Milestone
SUI has achieved a significant milestone of establishing a token volume of more than 600 billion. This will be the historic turning point in the ecosystem and reflect the growing adoption and liquidity of the network.
As recent statistics published on social media indicate, the token volume has experienced an impressive upward trend. The aggregate number of tokens was an outrageous 600,130,463,980. The 30-day change represents a robust growth rate of 7.76%, which is a good signal of the blockchain on a positive trend in the short-term.
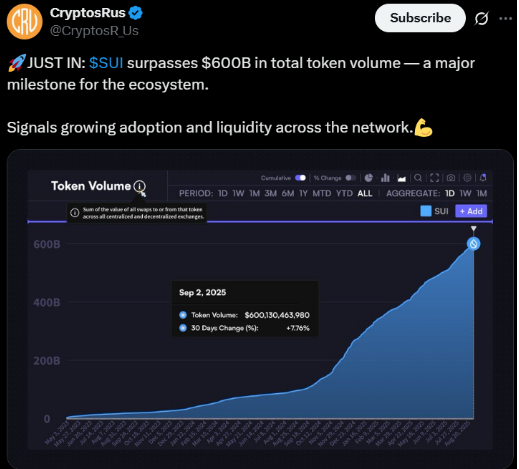
The statistics represent the total value of all token swaps in both centralized and decentralized exchanges and they demonstrate the massive network activity. This is a solid indicator of the rising trust in SUI, as users keep on trading on the site. The rising liquidity also highlights the platform’s strong position in the competitive crypto environment.
Analyst Predicts Bullish Breakout for SUI Price.
Crypto analyst has shared an update on the SUI token, which shows a falling wedge pattern on its chart. The falling wedges usually indicate an upward price trend and a possible bullish breakout.
The analyst notes that SUI would be heading to its all-time high once the price goes beyond the $3.52 level. The analyst also indicates that buyer interest appears to be high and that there is an indication of upward drive. The target is the $3.52 mark, which might be overcome, resulting in additional profits. Investors will be interested in whether SUI will break this resistance or not in the near future.
SUI Price Struggles at Key Support Levels
The SUI price traded at $3.24 as of September 2025. The market shows a slight upward movement of about 0.75%, with the price recently fluctuating. SUI price has faced major resistance and support levels in its recent price movement, as the upper resistance is around the level of $3.50 and the major support is around the level of $3.00.
There has been a declining bearish trend in the moving average convergence divergence (MACD) indicator, with the MACD line at 0.0052 slightly above the signal line at -0.0361. The histogram above (MACD section) indicates that the bearish momentum has decreased slightly but remains in the negative area.
The asset’s Relative Strength Index (RSI) is 48, which indicates that the SUI price is on the brink of the neutral zone but bears some bearish pressure.
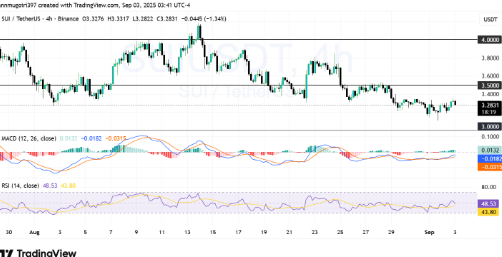
In the future, the traders are to look at the resistance at the level of $3.50, and it may turn out to be a decisive breakout point of SUI. An upward movement beyond this price can signal a transition to a bullish trend, which can drive the price to the next resistance of about $4.00.
Conversely, falling below the support level of SUI at below $3.00 may indicate a further drop to $2.80 or even less, depending on the market condition.
Disclaimer
This article is for informational purposes only and provides no financial, investment, or other advice. The author or any people mentioned in this article are not responsible for any financial loss that may occur from investing in or trading. Please do your research before making any financial decisions.



