Zylo Ecosystem
 astronaut
 Pearl
Pearl Walrus
 Starknet
 Pudgy Penguins
 Bitcoin

Binance Coin (BNB) has surged to new highs, sweeping past previous resistance. TradingView data show that BNB price has been on an increase. It soared over $1,000 with a one-week profit exceeding 13%.
Weekly Chart Signals Higher Highs on BNB Price Prediction
Weekly BNB price charts show an evident trend of increased highs and lows since the beginning of 2024. Following a long consolidation between $570 and $750 until 2023, BNB tore past the upper limit by mid-2024, creating a new price trend.
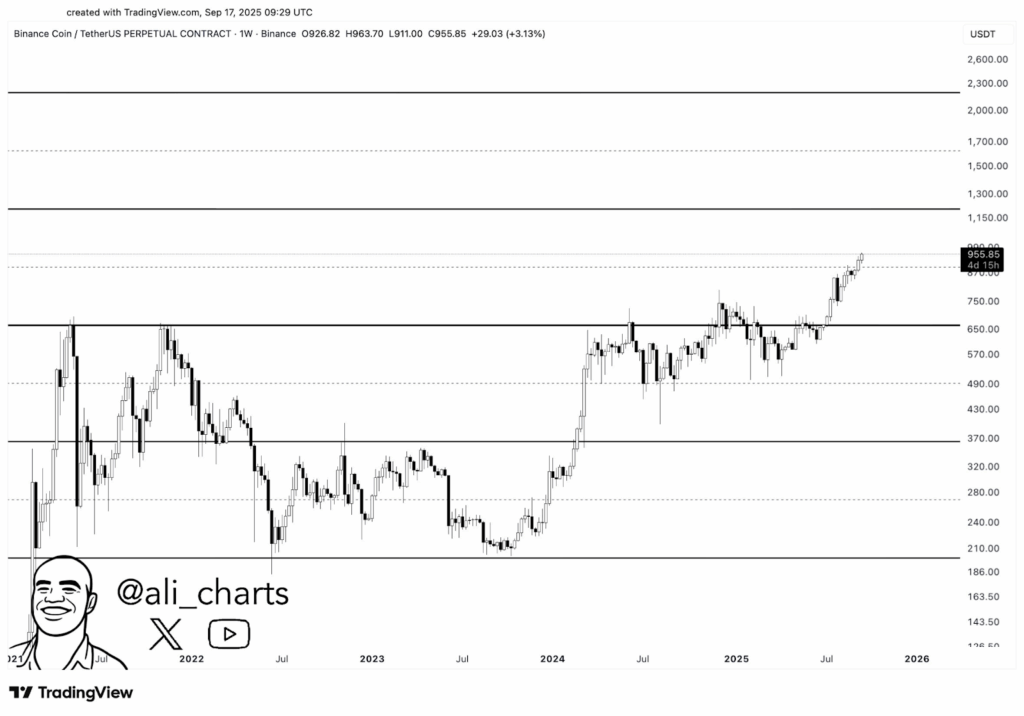
The candles have a very strong momentum. The weekly candle close is $955.85, with day peaks at 1,083. BNB price movement demonstrates that the next significant resistance spot ranges from $1,150 to $1,300.
Looking at a larger timeframe, the 2018-2025 long-term chart indicates that BNB has broken above a horizontal limit between $700 and $750 since May 2021, which has held prices down.
This move is similar in 2020 when BNB broke out of a lower level of less than $50 to above $600 after breaking a comparable long-term resistance.
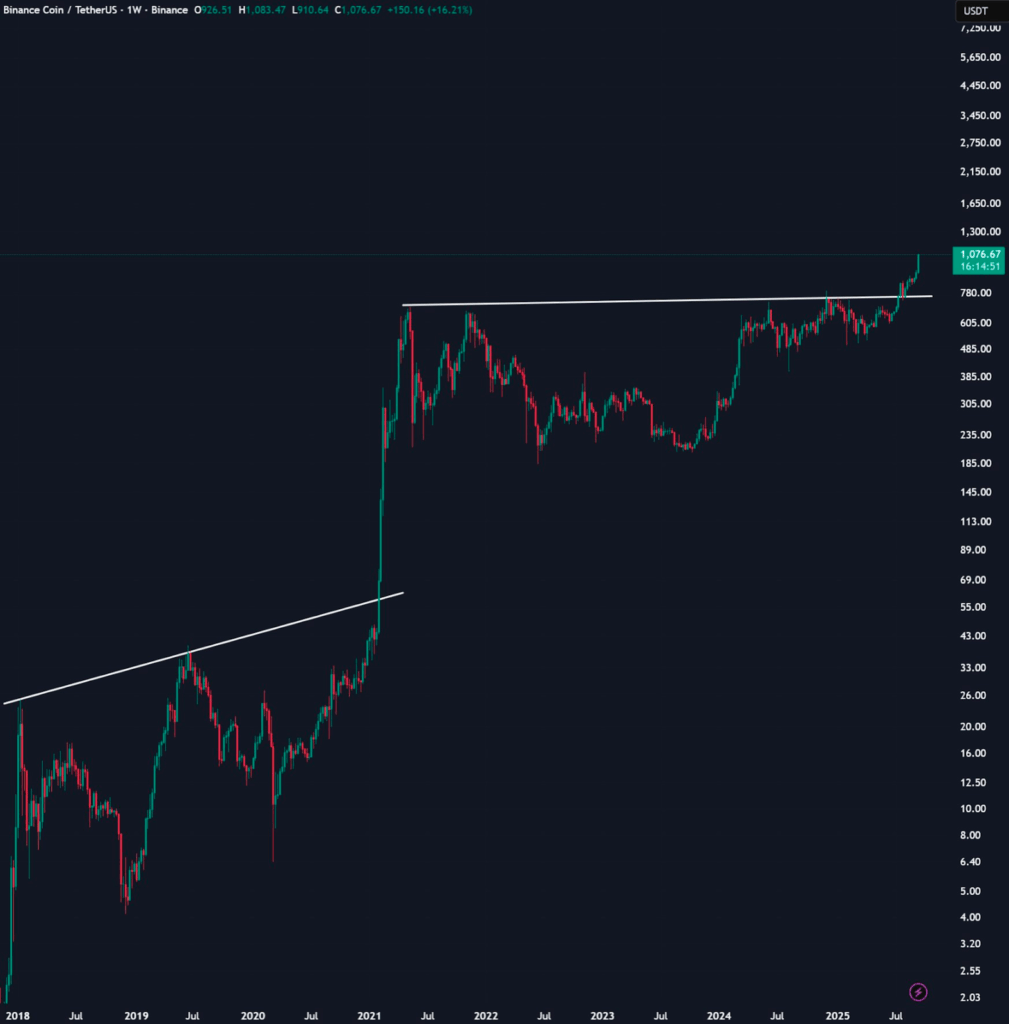
Such historical trends normally show tremendous growth, as former sellers are forced out and new buyers are brought in at new rates.
The next resistance ranges visible to the asset are now unexploited territories above its previous all-time highs. Its next resistance is at $1,300, going further to $1,700, and then to $2,000.
BNB Price Prediction Shows Overbought But Strong Trend in Price
Looking at more BNB price charts, which also show broken resistance, the RCI ribbon indicator shows that it is overbought. Still, the trend is strong and intact. Overshoots in readings at various time frames are all over 90. It implies that the market is in a strong bullish mode.
Although these large readings occasionally lead to pullbacks, they also frequently continue throughout breakout rallies’ initial and intermediate stages. Volume data support this interpretation. The increasing participation since mid-2024 means that BNB has interest in the market over these new highs.
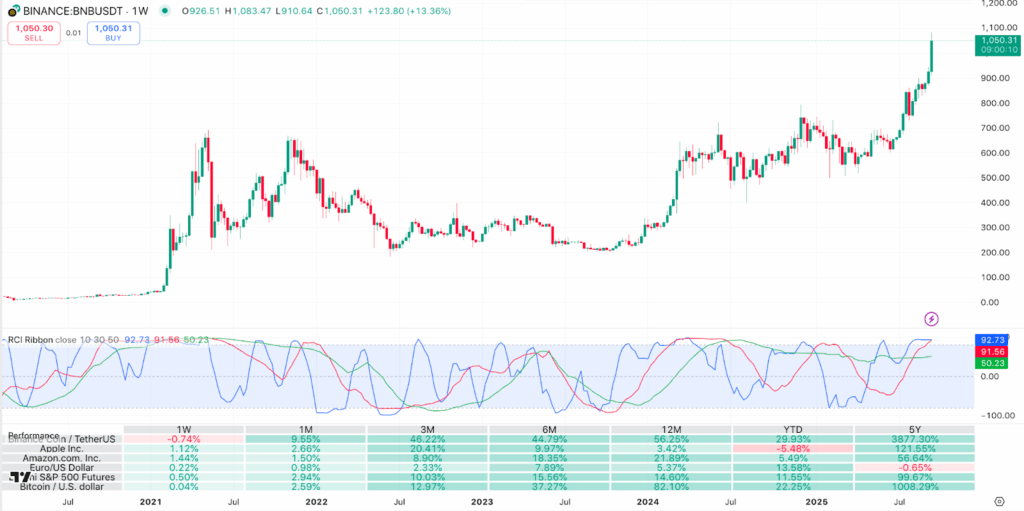
The performance table highlights that the cryptocurrency has been up 44.79% in the last six months. Its yearly growth has been 56.25%.
The returns are 29.93% year to date, with the traditional performance far behind S&P 500 Futures (11.55% to date) and Bitcoin (22.25%) in the lead.
Taking a five-year perspective, BNB has gained an incredible 3,877% gain. Thus, it has become one of the most successful large-cap digital assets within the five years.
The $1,150 to 1300 range has become the area to observe as BNB is heading towards unexplored price territory. Assets that broke higher than earlier all-time highs usually rest or consolidate at the psychologically significant round figures.
The behavioral pattern of BNB in this region will aid in establishing whether the trend will go to the projected 2,000 mark. Continued closes above $1,150 would confirm the breakout, and the pattern would be tested to higher levels.