
 Walrus
 Quantus
 Pudgy Penguins
 Bitway
 Quant
Quant Sui
Sui Bitcoin

Chainlink price has fallen by over 2% within the last 24 hours as the token nears a crucial technical support area. When writing, the LINK price was $20.51, a 2.96% drop in valuation for the day.
On the flip side, the trading volume increased by almost 45% to hit $1.17 Billion. This indicates increased activity in light of increased volatility.
Downtrend Accelerates Toward Triangle Support
Chainlink price charts indicate that LINK is trading in a multi-year symmetrical triangle. The recent weekly calls suggest the LINK price is just above the long-term support, near the $1920 range.
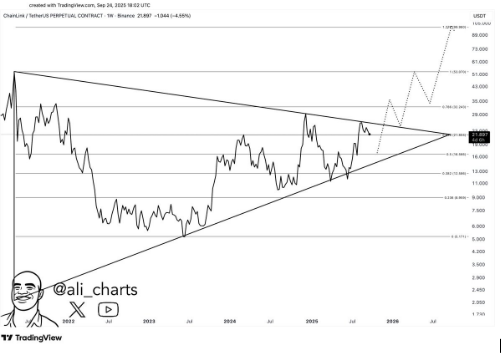
On the negative side, LINK might become vulnerable to the following central retracement point of the currency at around $16.56. This is indicated by the $0.5 Fibonacci retracement of the last cycle.
Ali Martinez names this region as a possible entry area before a potential recovery attempt in an entry-level role.
Chainlink Price Showing Volatility
The short-term view, however, is strained. As shown in the 4-hour chart, the Chainlink price has been trading in a downward channel since the middle of September.
It has continued to move downward since the point of $25. The last few sessions recorded a price that fell below the support of $21. This validates bearish control.
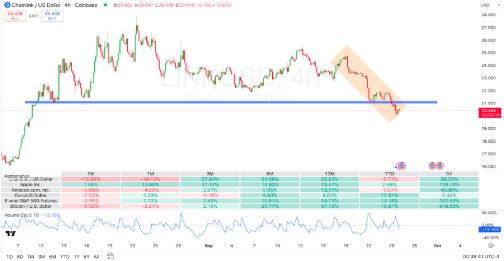
This pullback comes after lower highs on the 4-hour and daily charts. This puts more bearish pressure on the token. There is a notable $20-21 support range. It is currently acting as a significant cushion against further falls.
Indicators show the risk-averse mood prevailing in Chainlink markets. The Volume Oscillator is at -13.76, indicating that the buy side pressure is declining compared to the sell side buying.
This is consistent with the higher level of trading observed in the present pullback. It is usually indicative of more bearish pressure.
Chainlink Prices Struggling to Keep Up
Performance data strengthens this weakness. LINK has fallen by almost 13% in the last week and 16% in the previous month. This is despite recording three-month returns of 57.9% and twelve-month returns of 62.8%.
So far, though, LINK is still falling 5.73% compared to a 15.8% YTD growth on Bitcoin. Despite current weakness, Chainlink’s long-term structure remains intact. The asset has been consolidating within a tightening price range since 2022.
The symmetrical triangle remains a significant technical formation. In the past, these trends tended to be followed by substantial volatility after establishing the breakout direction.
The upper resistance level is currently near $32.24. This aligns with the $0.786 Fibonacci retracement. Chart analysis suggests a bullish target as high as $100. A decisive momentum shift could drive prices toward that level.
In the meantime, emphasis is placed on LINK’s reaction to its immediate support at these levels. Any prolonged position above this level would stabilize the price activity.
However, a failure would increase losses to $16.5. Many traders have set this as a major dip-buying point. Bitcoin saw a weekly decline of 5.5%. Despite that, it posted a 67% gain over the past year.
This outperformed LINK, which rose 62.8% in the same period. Chainlink has struggled to maintain its momentum. Bigger-cap digital assets have shown stronger performance. This is despite LINK ranking high in market capitalization.



