
 Walrus
 Quantus
 Pudgy Penguins
 Bitway
 Quant
Quant Sui
Sui Bitcoin

Bitcoin price is eyeing a rebound toward $115,000 if the key $107,000 support level remains intact. Several analysts point to technical levels that could initiate the next rally. These charts suggest further upside with a possible target beyond $123,000.
Bitcoin Price Holds $107K Support
Analyst Ali cited $107,200 as an important support level. A move above this level could initiate a further rise towards $115,000 and $123,000. Ali’s chart showed Bitcoin consolidating near support after recent declines. Interestingly, a strong support of $107,200 could form a basis for a bullish reversal.
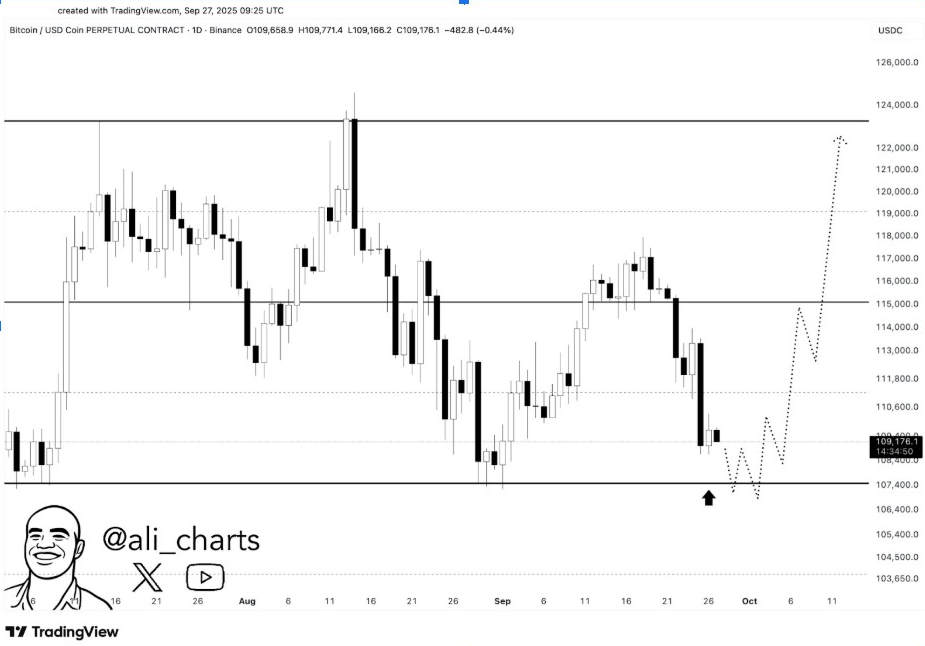
He outlined a possible path where BTC price retests $111,800 before challenging $115,000. Above that level, the next target level is around $123,000. The analyst cautioned that if the level drops below $107,200, the pattern would no longer hold and the chance of a downside move would be greater.
Notably, Ali emphasized that buyers need to show strong momentum to confirm a rebound. However, if holding fails, it could reverse market sentiment and trigger further selling towards the lower macro supports.
Flag Pattern Breakout Indicates $144K Upside
Javon Marks noted a large flag breakout pattern, which favors a long-tailed bullish outlook. His measured move projected Bitcoin price rallying beyond $144,000 if the pattern plays out.
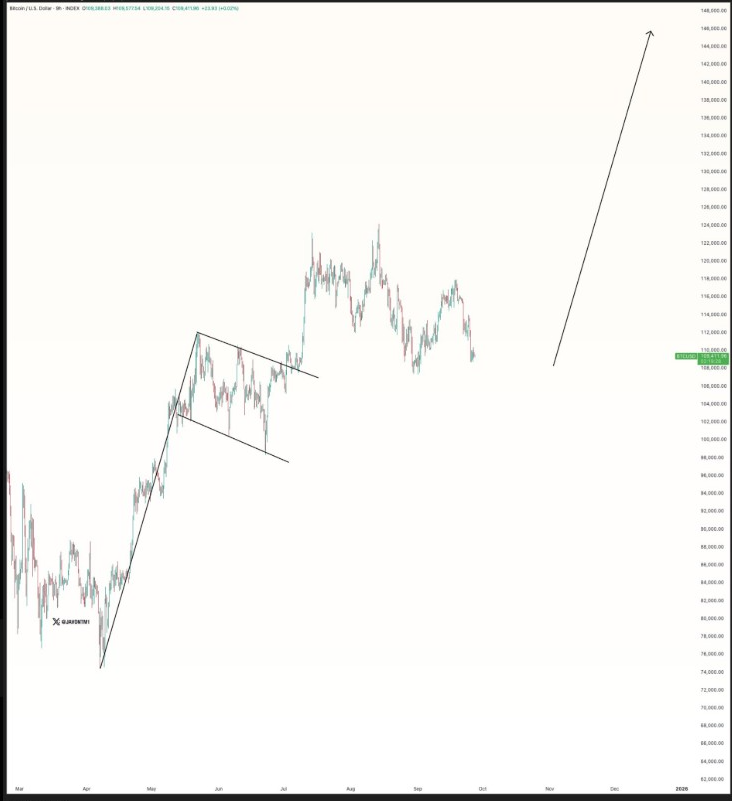
Marks showed that Bitcoin price has already completed a strong upward phase, followed by a prolonged consolidation forming a classic flag structure. Historically, such formations are followed by significant breakouts.
He argued that ongoing consolidation is a good thing, as it allows the market to absorb past profits. A rise above the upper support level would probably indicate renewed buying pressure.
Javon also said that this technical setup aligns with the overall bullish cycle and backs up the idea of a strong rally once resistance levels are broken.
Gold Cycle Rotation Adds to Bitcoin’s Supercycle Thesis
Meanwhile, Documenting Saylor linked Bitcoin’s next surge to macroeconomic flows from gold. He observed that every major gold rally historically ends with a Bitcoin price supercycle.
His comparative chart showed recurrent patterns in which capital shifts from gold to Bitcoin during strong uptrends. It supported the idea that Bitcoin price may soon attract large inflows as global liquidity rotates.
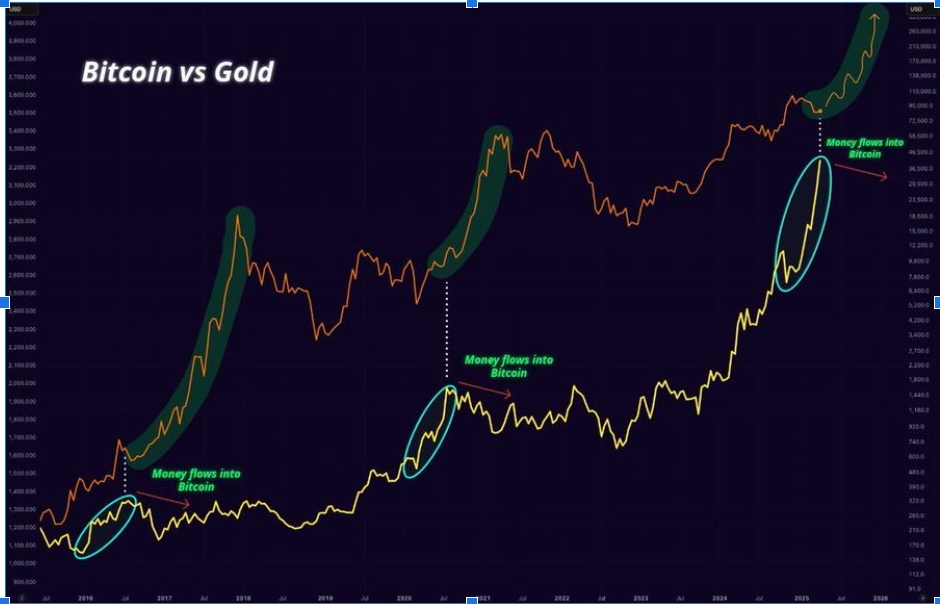
Saylor thought macro drivers such as digital store-of-value demand and inflation hedging would propel this change. He emphasized that institutional and retail investors increasingly prefer Bitcoin’s supply cap and technological edge over gold.
This macro backdrop and technical signals build a stronger argument for a sustained long-term bull market.
Macro Map Highlights Key Confirmation Levels
In addition, Eliz provided a broader technical map for Bitcoin’s current structure. She placed important levels of confirmation at $117,200 and $123,100, while reinforcing the $107,200 base.
According to Eliz, reclaiming $117,200 weekly would confirm bullish continuation and open up $123,000.
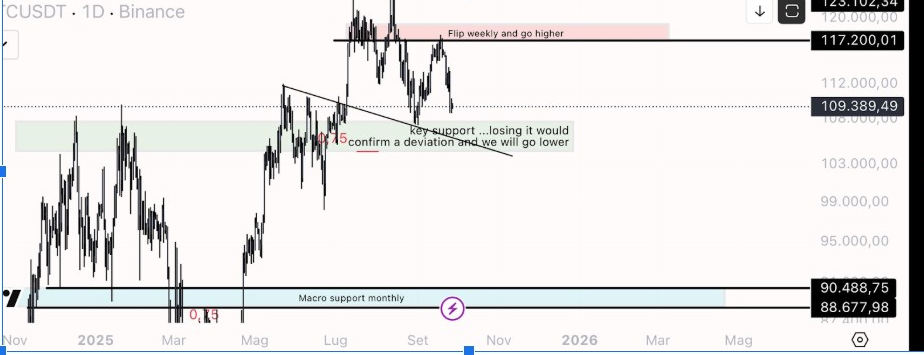
However, she cautioned that if the $107,200 level is broken, it could validate a deviation and force Bitcoin price to possibly drop lower, towards $99,000 or even $90,400.
Eliz’s chart demonstrated the importance of holding steady weekly closes above key resistance lines to maintain upward momentum. Traders should watch these levels to determine the strength of any potential rebound.


