
 astronaut
 Pearl
Pearl NEAR Protocol
 Walrus
 Zylo Ecosystem
 Bitcoin
 Hyperliquid

XRP price is showing new bullish signs, as technical indicators suggest a rebound. Analysts see big upside potential if support holds. The market is now watching closely for confirmation of a breakout towards $9.90.
XRP Price Receives Fresh Buy Signal
XRP price has generated a buy signal on the TD Sequential indicator, indicating a potential reversal. This signal has been pointed out by analyst Ali on the four-hour chart, suggesting that XRP could start recovering soon.
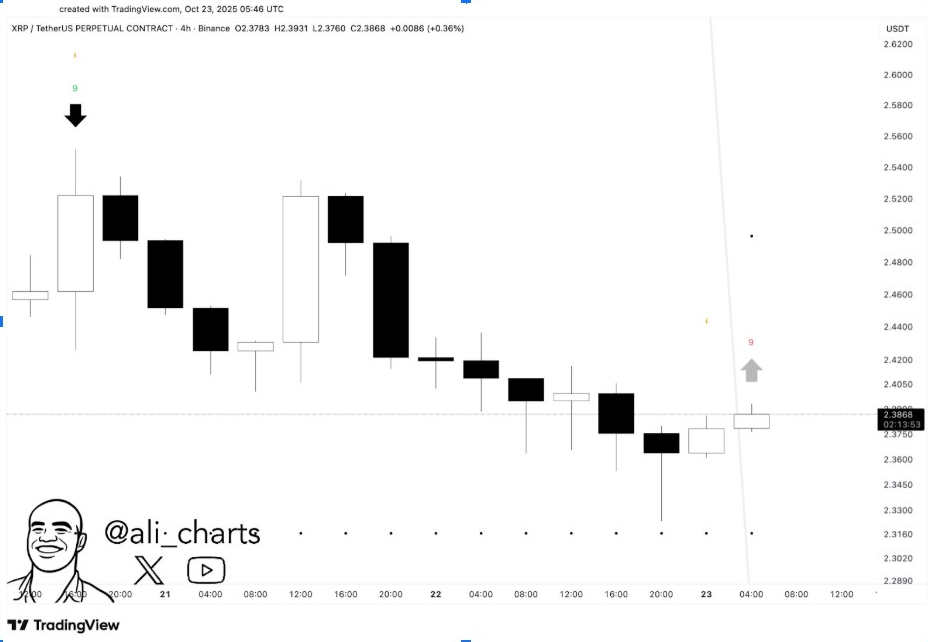
Historically, similar setups have been observed before short-term rallies, providing a base for a stronger upward movement. The chart displays early accumulation signals, with candles forming a potential foundation around the current $2.38 region.
If buyers can maintain the momentum, the next level of resistance is near $2.60. A confirmed rebound could cement bullish sentiment and confirm the current buy signal. Traders see this structure as a potential early phase of a potential medium-term rally.
Structural Patterns Mirror Previous Bull Run
Additionally, analyst Javon Marks noted that the structure of XRP is very similar to the situation preceding its previous major bull market. The chart pattern comparison between 2017 and 2025 shows repetitive accumulation, indicating a possible parabolic trend.
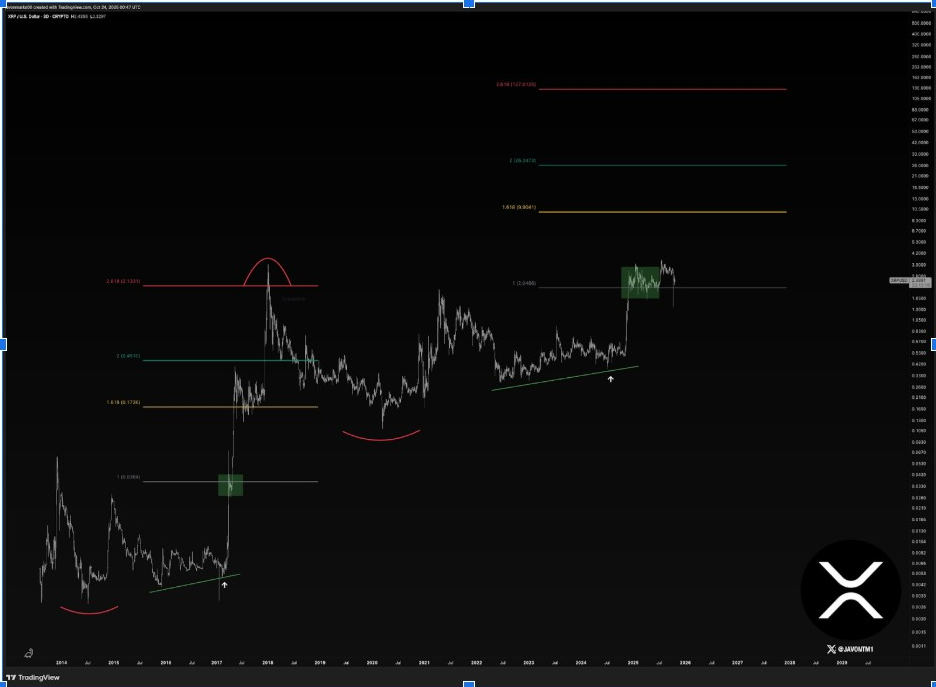
According to his analysis, XRP reaches $9.90 in case this pattern repeats as it did in the last cycle. This projection is an increase of more than 300% from current levels. Marks stressed that the market’s rhythm and fractal behavior remain consistent with previous price expansions.
Momentum is crucial here as further consolidation would strengthen the buy setup. A strong breakout above $2.60 could accelerate to higher Fibonacci targets, following the long-term projection.
Historical Channel Repetition Supports Bullish Outlook
Likewise, analyst EtherNasyonAL compared the current XRP price movement to the last cycle of 2017. His analysis shows that XRP trading is within the same logarithmic channel pattern, with accumulation around the midline, followed by expansion.
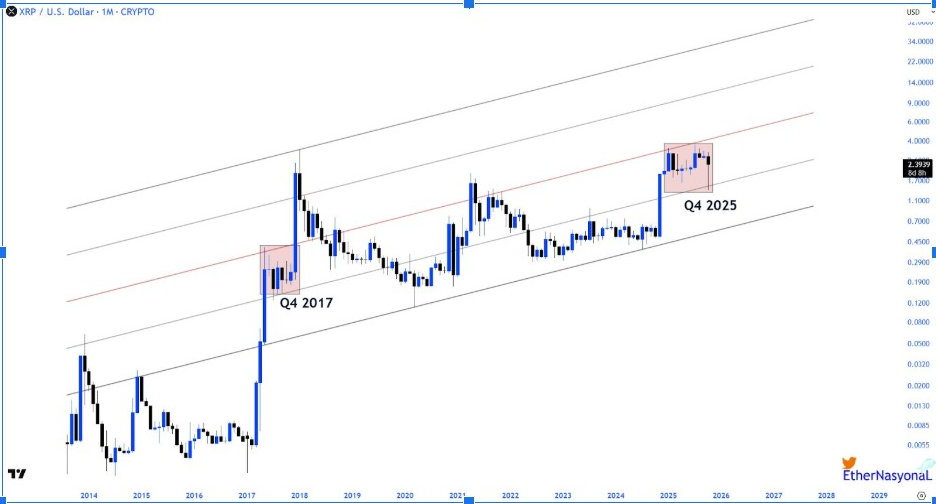
In 2017, the breaking of the mid-band saw a parabolic increase within months. Currently, XRP is testing the same structural midpoint, suggesting another potential huge rally. This comparison reinforces the notion that XRP may follow a similar path if momentum continues to build.
Furthermore, EtherNasyonAL’s long-term chart analysis indicated that the consolidation phase of XRP’s price mirrors past trends. Such a cyclic symmetry is often followed by renewed growth, particularly if market liquidity widens. Investors are constantly looking for confirmation candles for breakout continuation.
Profit-Taking May Temper Short-Term Gains
Meanwhile, on-chain data showed selling pressure from Ripple co-founder Chris Larsen, who recently sold millions of XRP. Analyst Umair Crypto had noted that historically Larsen’s sales have coincided with local price peaks.
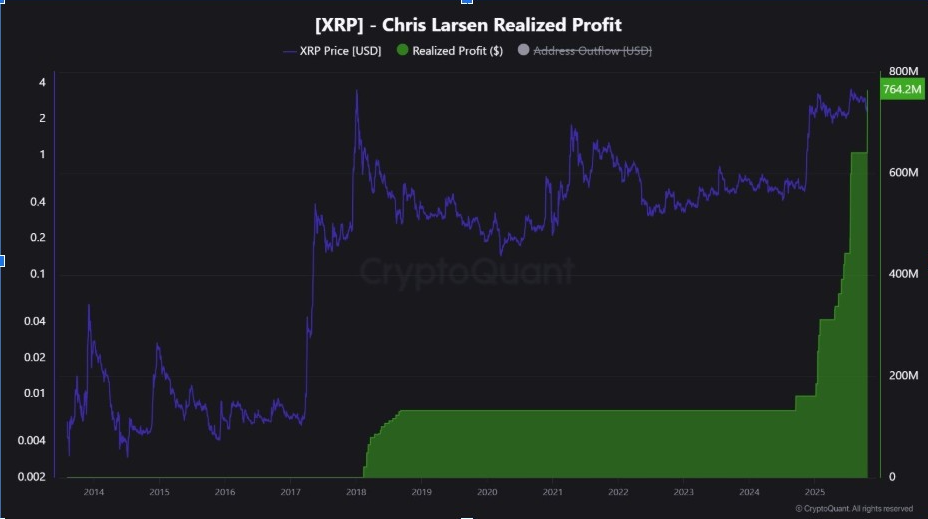
Data from CryptoQuant shows Larsen’s realized profit chart shoots upwards above $764 million, matching past distribution periods. This activity may put temporary resistance as trading reassesses short-term risk.
Meanwhile, sentiment remains cautious yet optimistic, with technical backing from the TD Sequential indicator. The selling trend could cap potential upside in the near term, but is unlikely to break down the longer-term structure.
Additionally, based on historical cycles, XRP tends to bounce back strongly after profit-taking events. Combined with the strengthening of technical alignment, many analysts argue that eventual continuations towards higher resistance zones can be expected given the easing of selling pressure.



