
 Bitcoin
 Ondo
Ondo NEAR Protocol
 Walrus
 Pearl
Pearl Pons
Pons Ethereum

Dogecoin price is gaining new strength after defending the $0.18 support level. Analysts expect an upward breakout as long as momentum continues. Several projections are suggesting possible targets of $0.25 and $0.33.
Dogecoin Price Maintains Key $0.18 Support
Dogecoin price continues to trade around the $0.18 level. It is considered a key support for maintaining bullish momentum. Analyst Ali emphasized that holding this support could lead to $0.25 and $0.33.
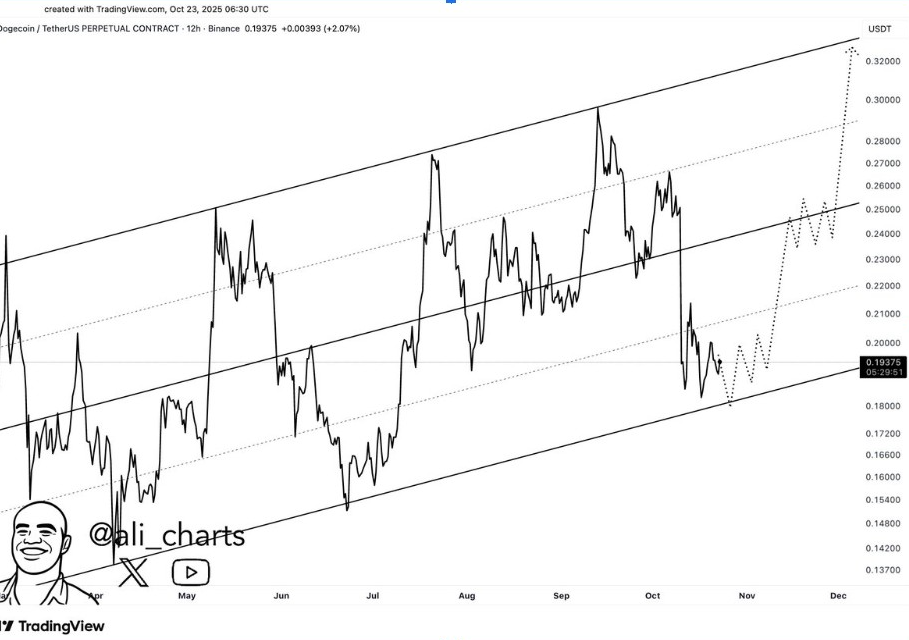
The price action has respected an upward channel formation since May. Every previous retest of this lower boundary has been followed by recovery periods. More so, current candles are again rebounding from this region, suggesting accumulation by buyers.
Moreover, support around $0.18 could mean the start of a new uptrend. The next resistance levels are at $0.22 and $0.25. A daily breakout above these ranges would be likely to create a bullish sentiment.
If momentum holds, traders are watching the next move towards a potential mid-term top at $0.33. Analysts believed this is the end of the identified trading channel and is in agreement with historical resistance.
Early Reversal Signs Boost Bullish Outlook
Furthermore, analyst BitGuru saw early signs of recovery following the correction phase of Dogecoin. The price is curving up with a bullish structure near support.
His chart revealed DOGE price has completed a consolidation stage and is trying to gain momentum back. If this pattern is accurate, the next upside zone will be between $0.22 and $0.25. Sustained trading above this band could be a confirmation of a short-term breakout.
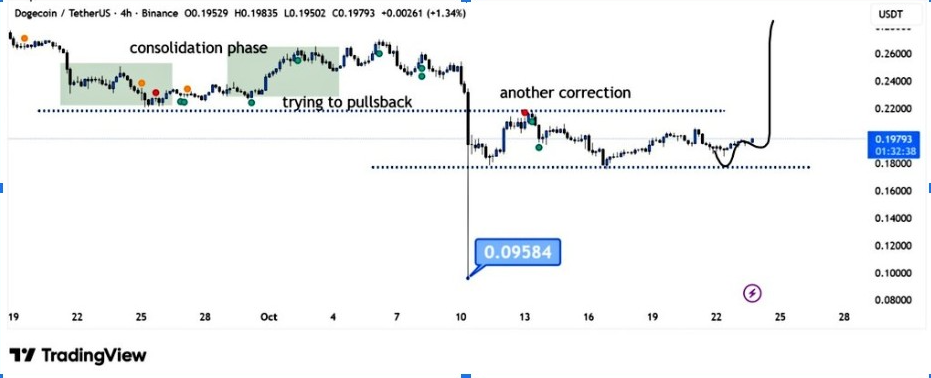
Additionally, this phase followed a long-lasting correction that started in early October. The stabilization around $0.18 shows less selling pressure. This is an indication of renewed interest from buyers. Traders view this as a good formation for a gradual recovery.
BitGuru’s analysis also revealed the importance of continued volume confirmation. Rising volume on rebounds has been a historical indicator of a more decisive breakout.
Long-Term Structure Suggests Upside of 270%
Similarly, analyst Javon Marks pointed out that Dogecoin’s macro pattern is similar to past patterns leading up to big rallies. His model showed a potential 270% move toward new highs if momentum continues.
The chart highlighted recurring curved zones of accumulation leading to parabolic expansions. Current behavior is the third time that this formation has been seen. Also, there’s structural consistency with previous bullish cycles.
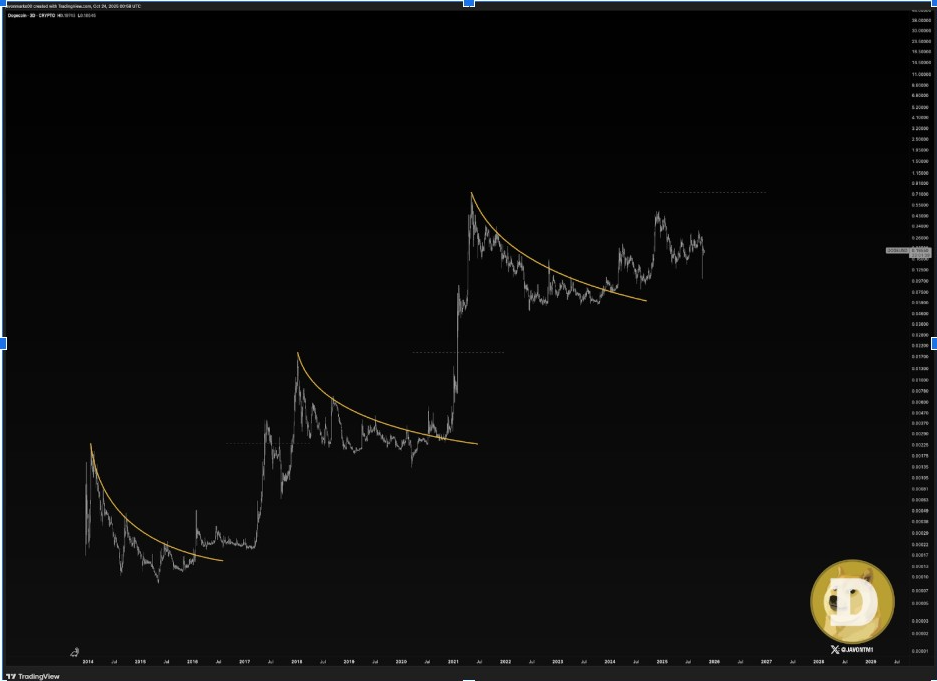
In addition, Marks pointed out that every rounded base pattern historically preceded exponential rallies after the breaking of resistance. The potential for trend continuation is still very high, considering the symmetrical chart history of Dogecoin.
Moreover, the setup suggests that the ongoing recovery may last for weeks. If confirmed, the price may exceed $0.30 and target new all-time highs. Many traders are closely watching for signals of confirmation on higher timeframes.
Chart Patterns Signify Breakout Continuation
Meanwhile, technical analyst Trader Tardigrade spotted two simultaneous bullish patterns on Dogecoin’s chart. It’s a descending triangle and a falling wedge. Both patterns indicate a possible breakout continuation.
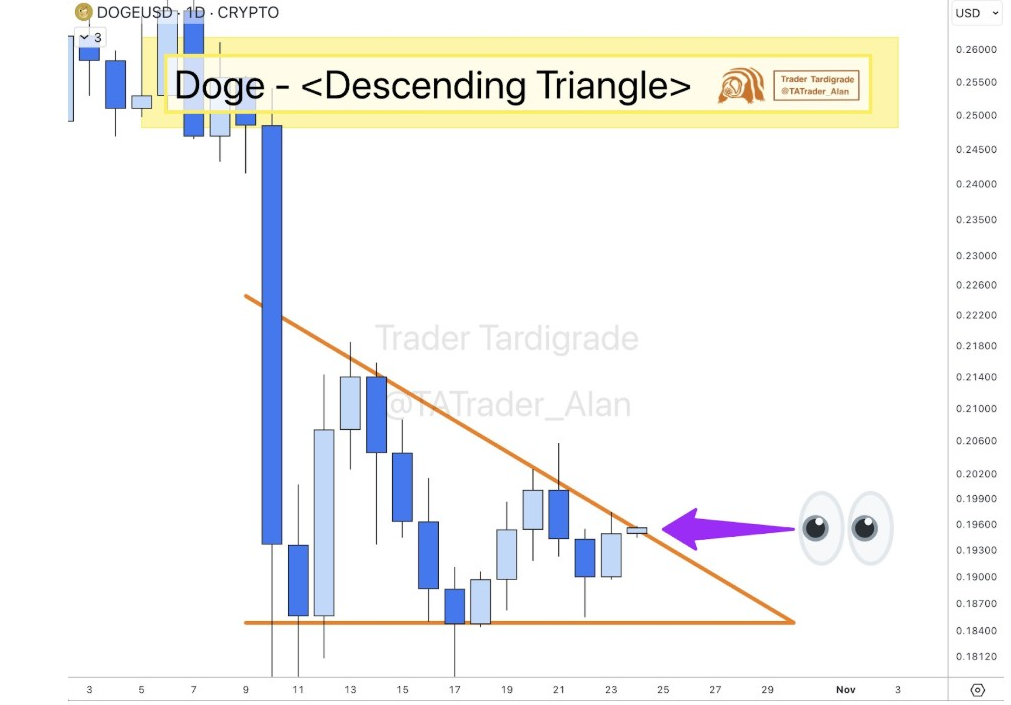
According to his analysis, on the daily chart, the DOGE price was trying to break out of a descending triangle. This pattern usually precedes an upward reversal after the resistance has been broken. The projected target is within the range of $0.25.
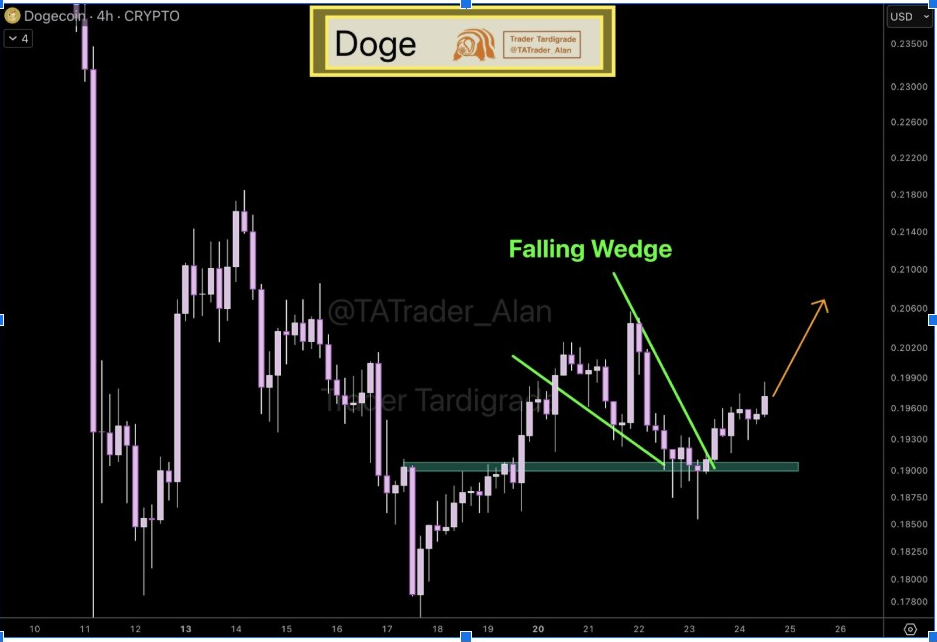
Additionally, the four-hour chart confirmed that Dogecoin just exited a falling wedge, another bullish continuation structure. A move above $0.20 would confirm this breakout and draw renewed buying activity in.


