
 astronaut
 Pearl
Pearl NEAR Protocol
 Starknet
 Zcash
Zcash Pudgy Penguins
 Ethena

Binance Coin (BNB) has entered a cooling-down period after a sharp increase in November. The token is currently resting well above some of the most critical long-term support levels. The pullback is technically healthy as long as BNB remains above the green highlight band.
Charts show that the BNB price has observed the key areas throughout several market cycles. The green support region currently lies between $634 and $689.
This band had historically been a ceiling in the 2021-2022 rally session. This zone became strong support when Binance coin price reclaimed it in 2024.
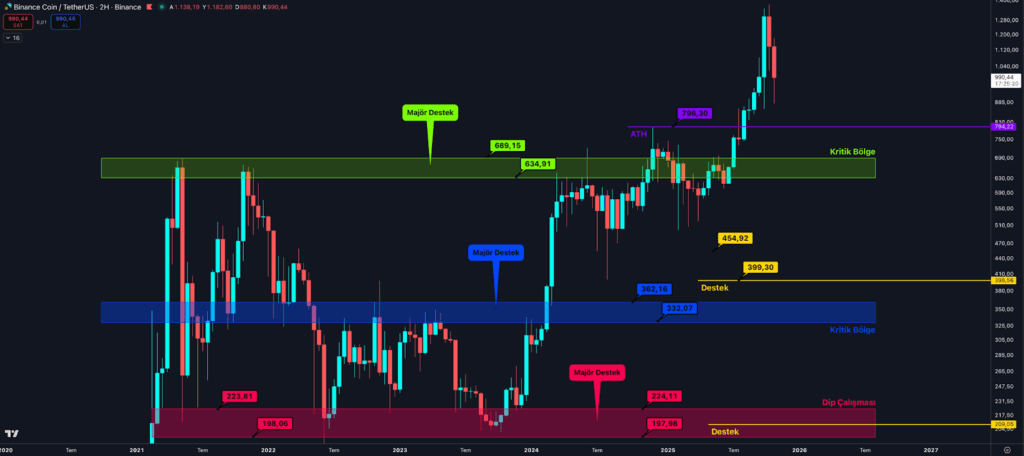
The all-time high (ATH), which was around $794, has become an intermediate support zone. The latest price moves of the BNB have also seen the token moving beyond this historical resistance. BNB price went above $1,200 before decelerating to the $980-1,000 levels.
This action demonstrates that, although the rally has stalled, the higher-timeframe structure remains bullish. The support at $634-$689 still forms a solid point for any possible rebounds. The mid-range price of $794 provides a solid foundation for the bullish argument in the event of a test.
Short-Term Dynamics Show Neutral Movement on BNB Price
Short-term BNB price charts show a gradual pullback after hitting its early November highs. The zone reflects a recovery trend based on the lows of $880 to $900 on November 3-4.
It was followed by an increase in value till the price reached the $995-$1,010 resistance zone. There is another range of resistance above this band, between $1,100 and $1,140.
The chart also shows a consecutive increase in the bottoms based on a rising trendline. It proves bull action at each low point.
The Relative Strength Index (RSI) is around the 55-56 level, showing neutral momentum. This implies that they are at a stage of consolidation and not distribution. This observation can also be supported by volume data, as there is no extreme volatility on the balance.
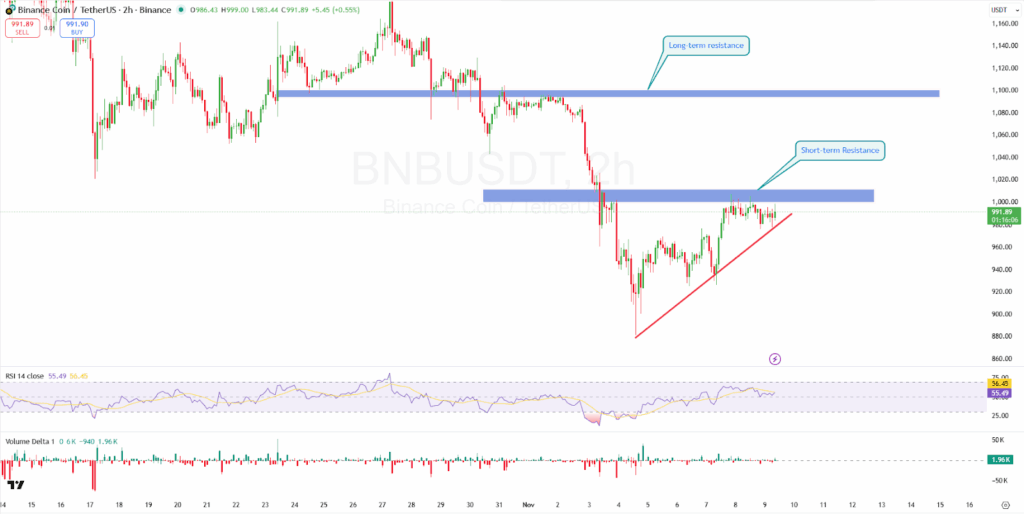
That could mean the pullback is a normal rest in the larger bullish trend. It could also mean the market is digesting previous gains, keeping above the structure. The structure forms the foundation for the next leg of movement.
Network Activity and On-Chain Data Signal Strength
On-chain data is giving a bullish outlook on the BNB price. As per the current statistics, about 2.3 million active addresses are on the BNB Chain on a daily basis. The current stats represent a 28% increase in the past few weeks.
This was the highest activity on the network since it had over 3 million addresses in October. At that time, the price was surging to $1,200.
A number of active addresses remained close to two million upon the pullback. It is also indicative of the same utility and confidence in the network. This once again proves that a market correction is rather a technical reset than a structural downfall.
According to the CoinMarketCap data, BNB price was approximately $985.26 as of press time. This experienced a decrease of 0.68% in 24 hours. Although the data shows reduced momentum in the short term, the coin remains in a bullish structural range with the level of stability above vital supports.




