
 Bitcoin
 ZKsync
 Pudgy Penguins
 Pearl
Pearl Quantus
 Starknet
 NEAR Protocol

HBAR price has surged by more than 11% over the past 24 hours. Renewed market confidence and strong volume growth drove this. Trading activity increased 140% to $480.8 million.
This reflects growing participation from retail and institutional investors. Analysts are watching for a potential 90% breakout as Hedera price continues to build technical strength.
HBAR Price Eyes Breakout Above $0.20
HBAR price is still trading in a descending channel that has defined its structure since mid-August. The pattern exhibits alternating phases of compression and rebound, indicating a gradual accumulation of bullish momentum.
At the time of writing, the Hedera price traded near $0.192. It bounced strongly from a support zone that held firm during the previous rally. According to the chart patterns, this level serves as a crucial base for renewed accumulation.
Analyst ZAYK Charts noted that the structure is similar to that in June. At that time, the HBAR price broke above the upper trendline and rallied by 120%. If a similar breakout above $0.20 occurs, the next major resistance zone is around $0.40.
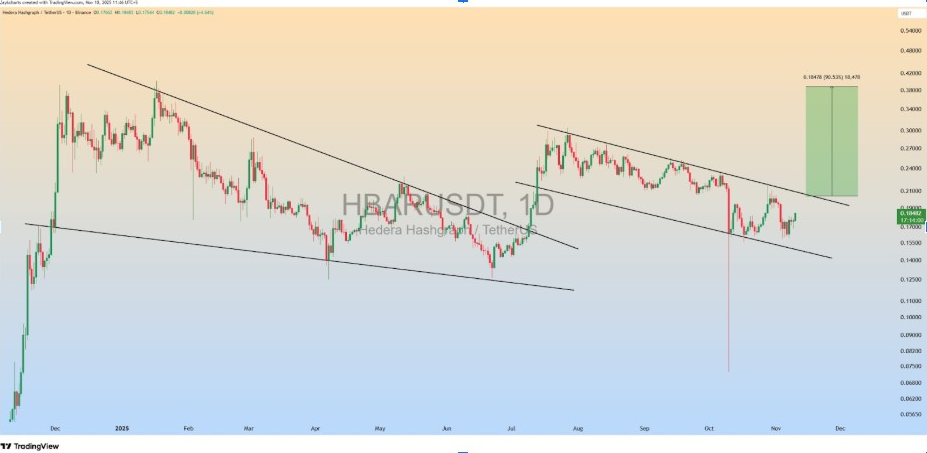
Repeated higher lows confirm this bullish pattern and that buyers are reasserting control. Sustained volume above $0.20 could validate the setup and drive price discovery toward the projected $0.400 mark.
Cup and Handle Signals Bullish Continuation for HBAR Price
Hedera price chart also showed a forming cup-and-handle pattern on the 1-day chart. Such a trend implies a long-term bullish trend consistent with the broader recovery since mid-2024.
The price has strongly bounced down to the $0.159 level, creating a rounded base that is healthy in terms of accumulation. A confirmed breakout above the $0.201 neckline could trigger a rally toward $0.233 and $0.260. If momentum holds, the HBAR price may eventually reach $0.400.
The momentum indicators signal upward trends. The DMI shows +DI crossing above -DI, whilst the ADX reading of 24.95 indicates growing directional conviction. These readings suggest that buyers have gradually gained the upper hand over sellers.
As noted by analysts, the configuration is equal to the typical early breakout scenarios. Consistent closes above the neckline may signal the beginning of a new uptrend. Also, the volume growth further supports the trend.
Taker Buys Strengthen as ETF Demand Grows
The approval of the Canary HBAR ETF, a co-launch with Bitwise, was another significant boost to investor sentiment. The ETF commenced trading on Nasdaq as part of its current Solana and Litecoin offerings from Bitwise Asset Management.
This development will expand institutional access to Hedera exposure. This strengthens HBAR as an asset digital asset of investment-grade quality. Bloomberg analyst Eric Balchunas confirmed the listing and called it a milestone for the ecosystem’s legitimacy.
The introduction of the ETF is consistent with an explosion of derivative activity. According to Coinglass, Open Interest increased 11.12% to $146.3 million, indicating new speculative positioning. This jump in leverage reflects traders going long in line with bullish setups to higher price levels.
Market data also indicates that the taker buys control of the spot order flow. This implies that aggressive buyers continue to dominate momentum.
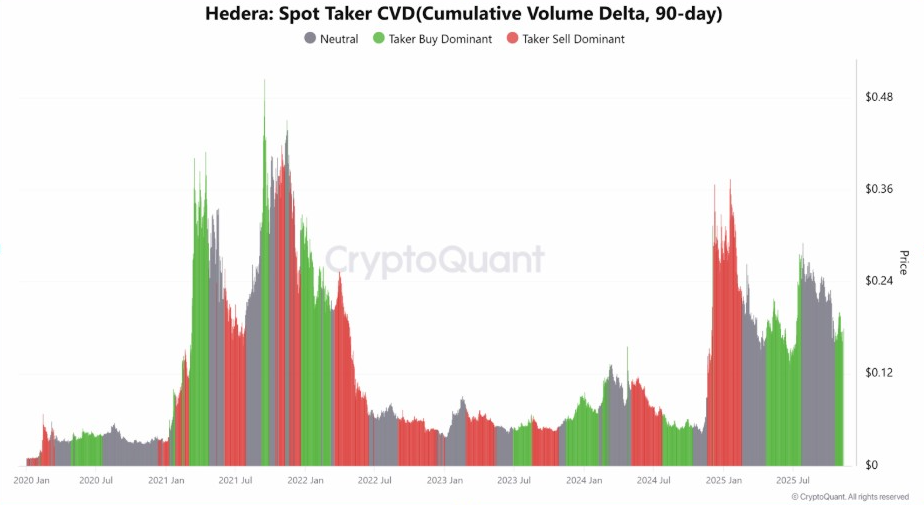
Inflows from ETFs and leveraged positions are fueling bullish sentiment. Analysts believe this could drive a 90% upside in Hedera price.
Analysts See 150% Upside if Resistance Levels Flip
Analyst Javon Marks reiterated his long-term bullish view, with a potential rally to $0.504, or a 150% increase. His chart showed HBAR price holding since breaking out of its multi-year downtrend.
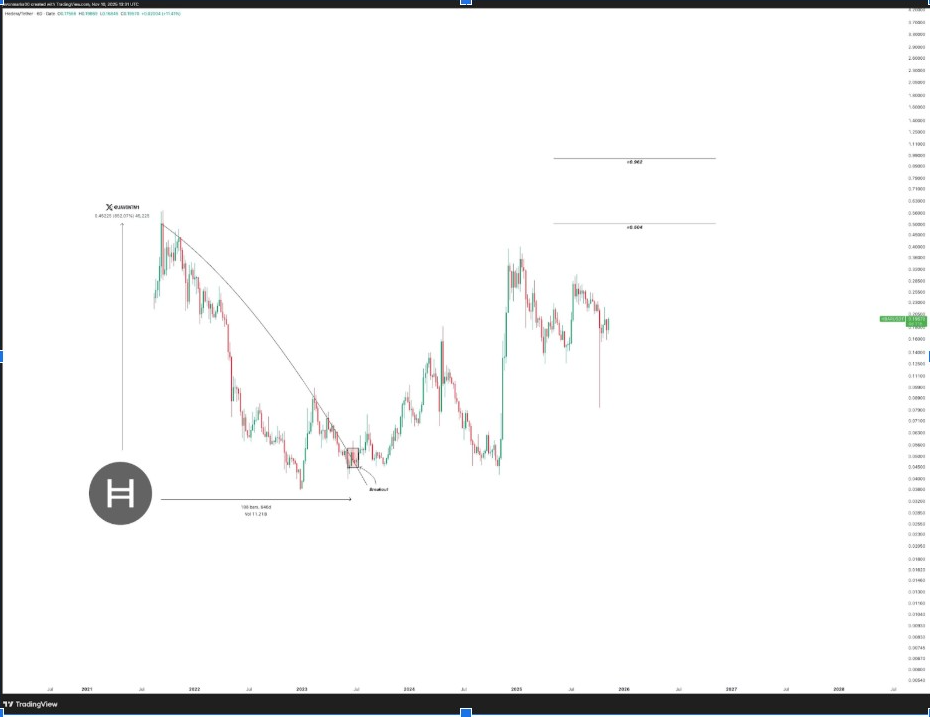
Marks added that there could be a clean break above $0.50, extending the move to $0.962. He said the retracement from late 2024 came into play. This sets the asset up for another round of expansion, but with improved technical strength.
Meanwhile, FLASH analysts highlighted the same descending channel seen on the daily chart. He said consistent closes above $0.20 may confirm a mid-term reversal.
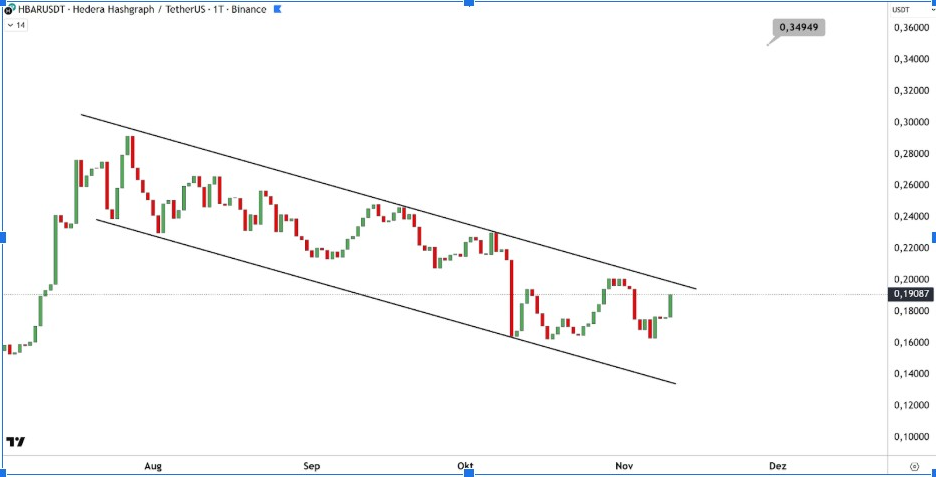
The bullish patterns that meet across multiple timeframes indicate strong alignment among analysts. Both traders and long-term investors are now watching the $0.20-$0.21 region for confirmation of a breakout.



