
 astronaut
 Pearl
Pearl Hyperliquid
 Walrus
 Pudgy Penguins
 Bitcoin
 NEAR Protocol

Chainlink price has come under increased pressure this month as traders remain in the sidelines and activity in the futures market deteriorates. LINK has already dropped by 43% from its highest point in August and could be at risk of further dips as a giant head-and-shoulders pattern forms.
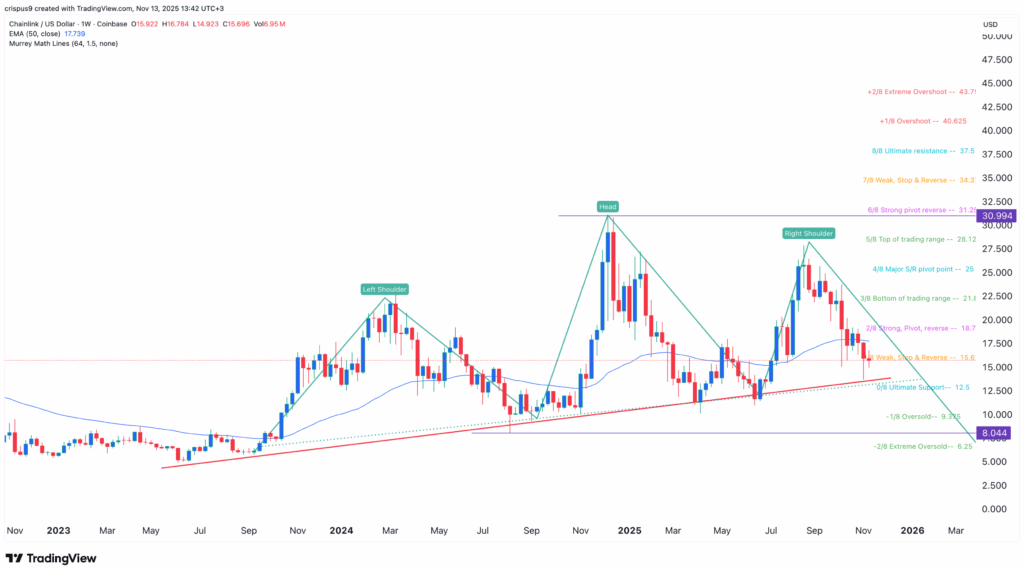
Chainlink Price Has Formed Head & Shoulders Pattern on Weekly
The weekly chart below shows that the LINK price has been under pressure in the past few months, moving from the year-to-date high of $31 to a low of $14 earlier this month.
It has remained below the 50-week Exponential Moving Average (EMA), a sign that bears are in control. Additionally, the coin has remained below the Supertrend indicator, indicating that the downward momentum is intensifying.
Most importantly, the coin has formed a giant head-and-shoulders pattern, a common bearish reversal sign. In this case, the head is at $31, while the right shoulder is around $28 and the left one is at $22. The pattern’s neckline is slanted, connecting the lowest swings since May last year.
The coin has moved below the Strong, Pivot, and Reverse points of the Murrey Math Lines tool, where most tokens normally rebound. Therefore, the most likely Chainlink price forecast is bearish, with the next key target being the psychological point at $10. A move below $10 will raise the possibility of it moving to the key support at $8, its lowest level in August last year.
On the flipside, a move above the psychological point at $20 will invalidate the bearish outlook and point to more gains.
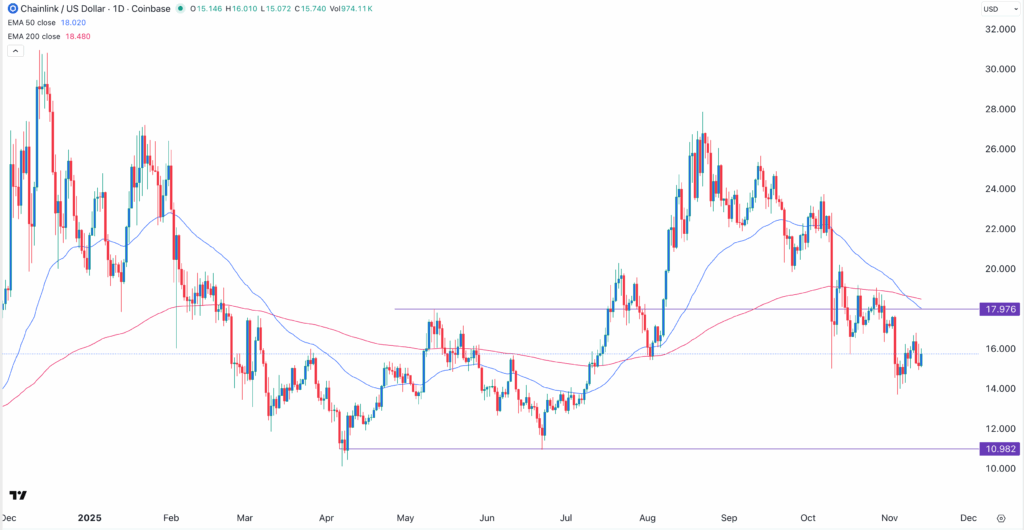
LINK Price Has Formed a Death Cross on the Daily Chart
Meanwhile, the daily chart shows that the LINK price has also formed other bearish patterns. For example, it has just formed a death cross pattern, which happens when the 50-day and 200-day Exponential Moving Averages (EMA) cross each other. This pattern normally leads to more downside.
The coin also remains below the important support level at $17.97, its highest level in May. This price was the neckline of the double-bottom pattern at $10.98. It also formed an inverse cup-and-handle pattern, which normally leads to more downside.
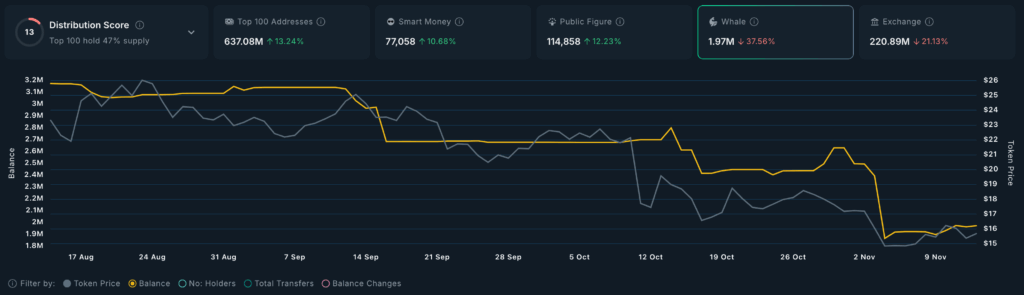
Whales Have Been Dumping LINK Tokens
These weak technicals likely explain why whales have continued selling the token despite its solid fundamentals in the decentralized finance (DeFi) and real-world asset (RWA) tokenization industries. Its supply on exchanges has also been on a freefall and currently stands at 220 million, down from 288 million last month.
Data compiled by Nansen shows that whales have been in a selling spree for the token in the past few months. They now hold 1.96 million LINK tokens, down from a high of 3.95 million in September this year.
Whale activity is one of the most important catalysts to watch in fundamental analysis. In most cases, whales normally buy cryptocurrencies before a rebound because of their experience.
The other main risk facing the Chainlink price is that leveraged traders have remained in the sidelines in the past few weeks. A good example of this is the performance in the futures market, where its open interest has tumbled.
Data compiled by CoinGlass shows that the open interest has dropped to $638 million, down from the August high of almost $2 billion. This interest has remained under pressure since October 11 when Chainlink bulls suffered a significant liquidation as crypto prices plunged.
At the same time, the weighted funding rate has remained closer to zero, indicating market illiquidity.
Summary
Chainlink has some of the best fundamentals in the crypto industry. It has the largest market share in the Oracle industry, has major partnerships with the largest companies in the US, and is utilizing its Strategic LINK Reserves to accumulate tokens. However, some of its fundamentals and technicals suggest that it has more downside to go.



