
 Pearl
Pearl Bitway
 Pudgy Penguins
 Quantus
 Walrus
 Quant
Quant Artificial Superintelligence Alliance

Ethereum price has continued to fall as selling pressure gains momentum across major exchanges. The asset is trading at around $3,160, down 10% over the past 24 hours, as large holders are moving funds amid increasing market volatility. Analysts now point out several crucial support levels that may determine the next move in direction.
Whale Activity Increases Pressure on Ethereum Price
A major whale, 66kETHBorrow, is continuing to accumulate large amounts of ETH despite the market drop. According to Lookonchain, the whale had bought 19,508 ETH worth $61 million just minutes before the latest decline. This pushes his purchases since November 4 to 405,238 ETH, worth $1.29 billion, at an average cost of $3,189. He now sits on more than $126 million in losses that did not materialize.
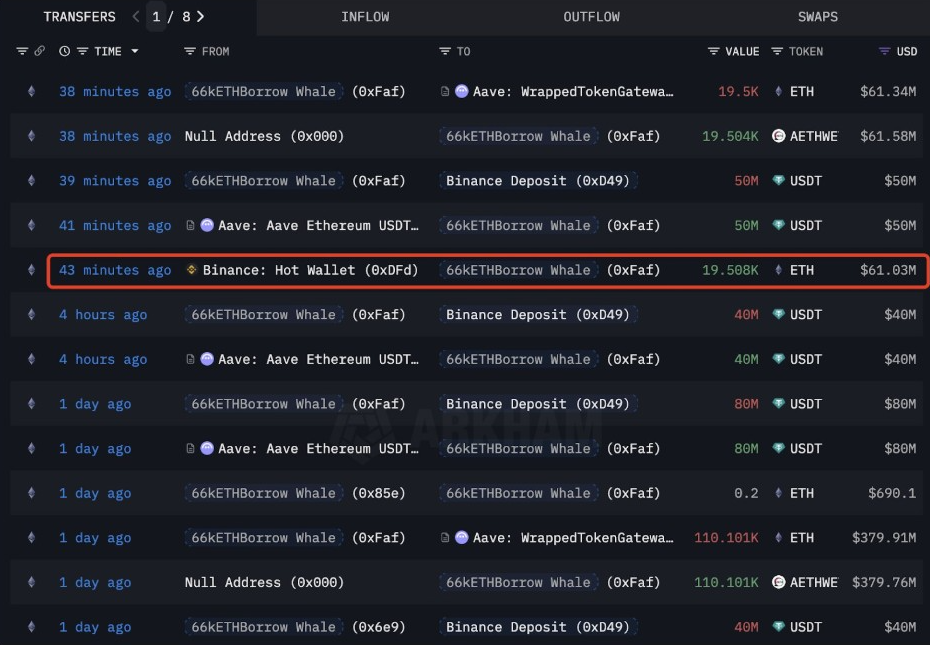
This whale has withdrawn funds through several transactions, including deposits on Binance and Aave. The regularly recurring inflows demonstrated an aggressive accumulation strategy during periods of weakness.
The pattern also indicated a strong conviction, even amid the current retracement. His activity has become a focal point for traders seeking to track large-scale movements. Many are looking for more whale-induced volatility in the short term.
Analyst Warns of Further Downside Toward $2,800–$3,000
Analyst Donald Dean believed the latest drop may continue to deeper support. He pointed out that $4,955 and $5,766 are valid targets, but the pullback may return to the $2,800 to $3,000 zone. He pointed to a vital volume shelf with a near $3,206 volume level, which coincides with the next major area of demand. The level could offer support if the current declines persist.
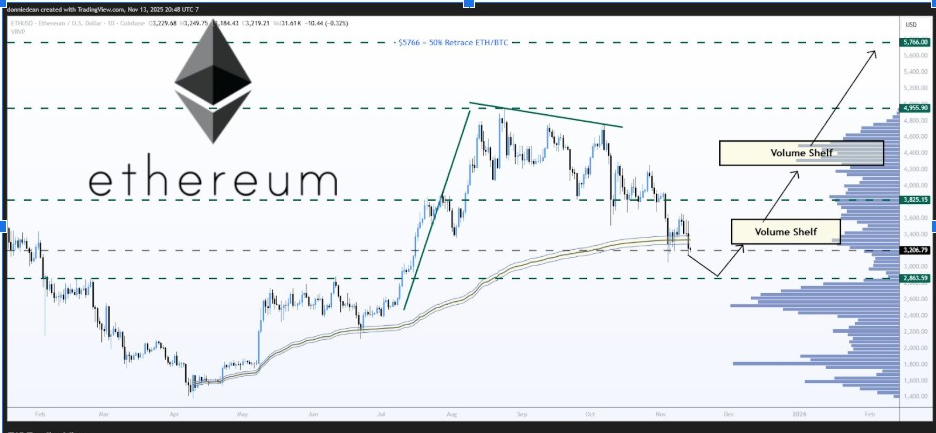
Dean said the latest structure reflects weakening momentum after several failed retests of higher resistance. The larger shift is now towards a corrective cycle, with the Ethereum Price paying back to the high market uncertainty.
His charts showed two volume shelves that may characterize the next rebound. The high shelf is priced at around $3,825, and the low shelf forms a firmer cluster at around $3,150. This lower band is now a critical demand region.
Cost Basis Heatmap Shows $3,150 as a Major Support
Data provided by Glassnode indicated that 2.53 million ETH was bought at $3,154 to $3,179. This makes one of the most significant cost basis clusters of the year. Analyst Ali confirmed that this band is now a major support zone.
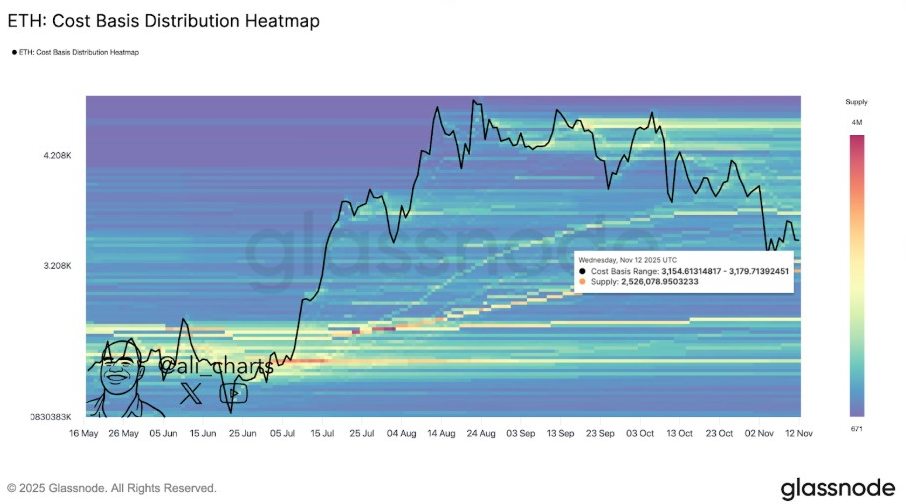
The heatmap identified concentrated long-term positions at this price, which makes it a structural anchor for the market. A clean break below this band could open the way for a move towards $2,863.
There is also a cooling trend at higher bands indicated in the heatmap. This shows that many short-term traders are taking a step back. The stronger holders, however, still maintain their positioning within this zone.
If buyers hold the $3,150-$3,180 range, Ethereum price can stabilize before a further push higher. But pressure from increased selling could still lead to a further test of the lower support cluster.
Long-Term Trend Still Intact
Furthermore, analyst StockTrader Max has a longer perspective. He highlighted that Ethereum tested the 50-week moving average after a 250% rally earlier this year. He argues that the long-term ascending trendline is still intact despite the current drawdown.
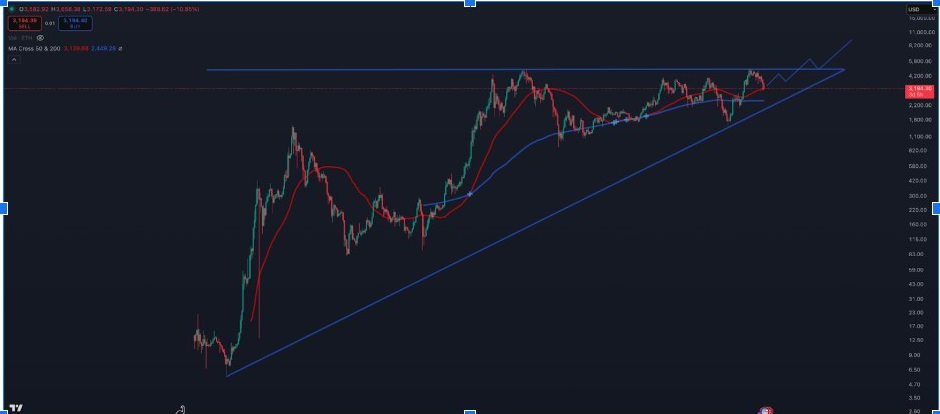
His chart showed a multi-year structure forming a rising wedge, with higher lows since 2020. A breakout from this structure remains a possibility once short-term emotions subside.
Max emphasizes that long-term momentum is strong. He said panic selling has increased, but Ethereum is still within its broader macro structure. He added that the 50-week EMA is often a make-or-break level during major corrections. Holding this range could place Ethereum price on a recovery once volatility calms down.


