Bitcoin
 Solana
 Pearl
Pearl Zerebro
 Aerodrome Finance
 LayerZero
 NEAR Protocol

Bitcoin price today continues to defend the key $88,000 – $89,000 zone support level after weeks of sharp correction. Sentiment remains cautious, with several technical indicators signaling a potential short-term rebound.
Analysts highlight divergences and cycle supports in the BTC price. They also note structural zones that could drive the next big move.
Bitcoin Price Today Holds Key Support Zone
CasiTrades stated that the Bitcoin price is currently testing the $88,000 support zone after a five-wave decline. Her chart has a complete (C)(5) leg within a green demand block, indicating possible exhaustion.
She showed a 1.236 Fibonacci extension at $88,313; this is consistent with support. This level has been supported through intraday retests.
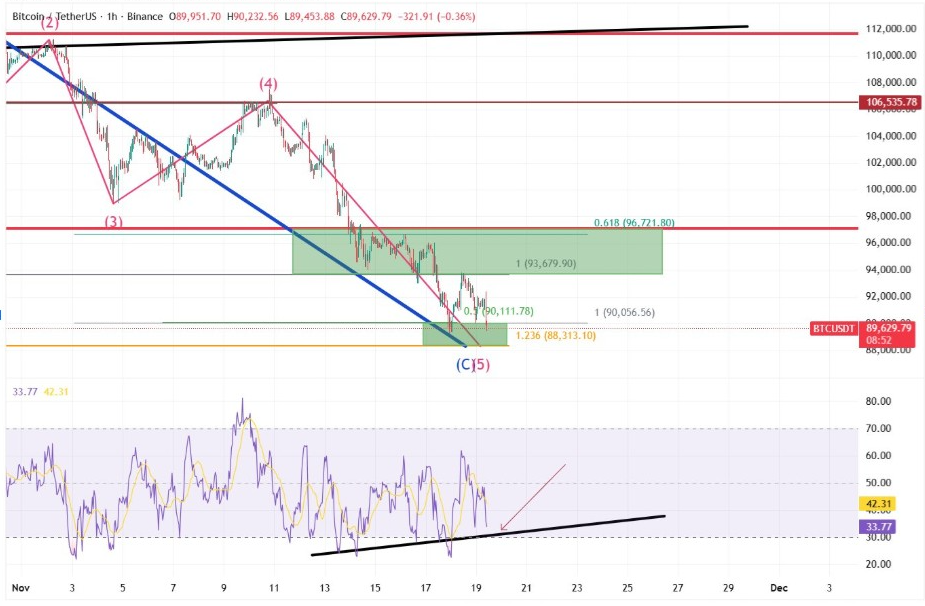
Momentum is stabilizing as well. CasiTrades pointed to a rising RSI trendline on the lower panel to create a bullish divergence. This divergence reinforces the likelihood of a corrective bounce towards the $93,600 – $96,700 range.
The 0.618 retracement level at $96,721 remains the key target for relief. If buyers show strength, BTC price could move toward this level.
Bullish Divergence Builds as Momentum Stabilizes
Similarly, Javon Marks noted a significant regular bullish divergence between the price and momentum oscillators. His chart indicated that the price is making lower lows while the oscillators are making higher lows.
Strong recoveries have followed this pattern in previous cycles. He suggests a rebound to $116,000 is possible if the momentum continues to improve.
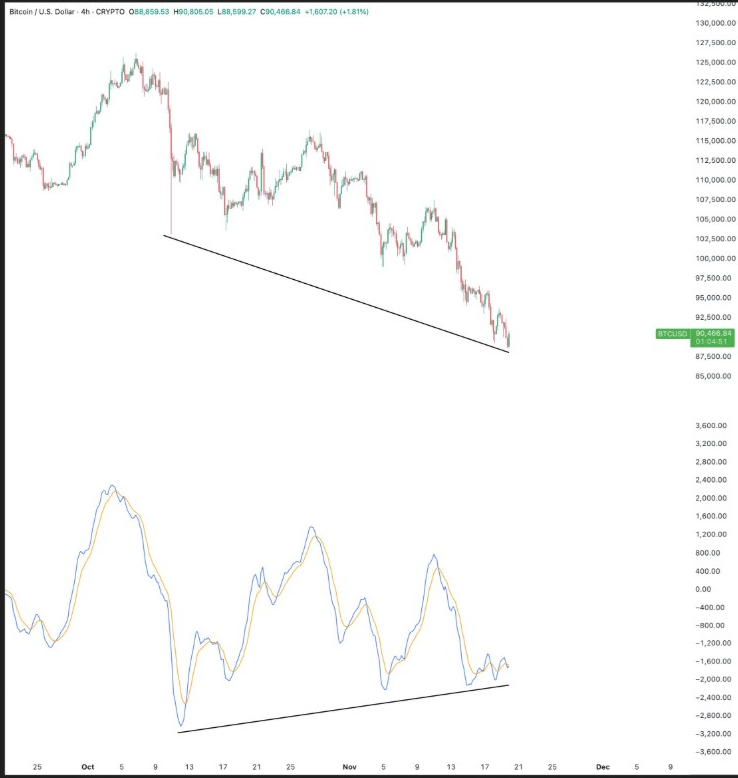
Moreover, the divergence is over several sessions and hence gains strength. Javon points out that this pattern tends to recover broken highs once it triggers.
Meanwhile, the Bitcoin price today has already touched the lower trendline of its divergence structure. A push above $92,000 would confirm the beginnings of this signal.
Bitcoin Price Today Slides Under Key Weekly SMA Level
However, Ali’s chart showed the top cryptocurrency trading back under the 50-week simple moving average. This level has guided major trend reversals in past cycles, so the current breakdown is significant.
He noted that the last time BTC price fell below this moving average, the market plunged. That decline measured about a 66% drop from peak to trough. The latest weekly structure is similar, with Bitcoin price today dipping below the curve and weakening momentum on higher timeframes.
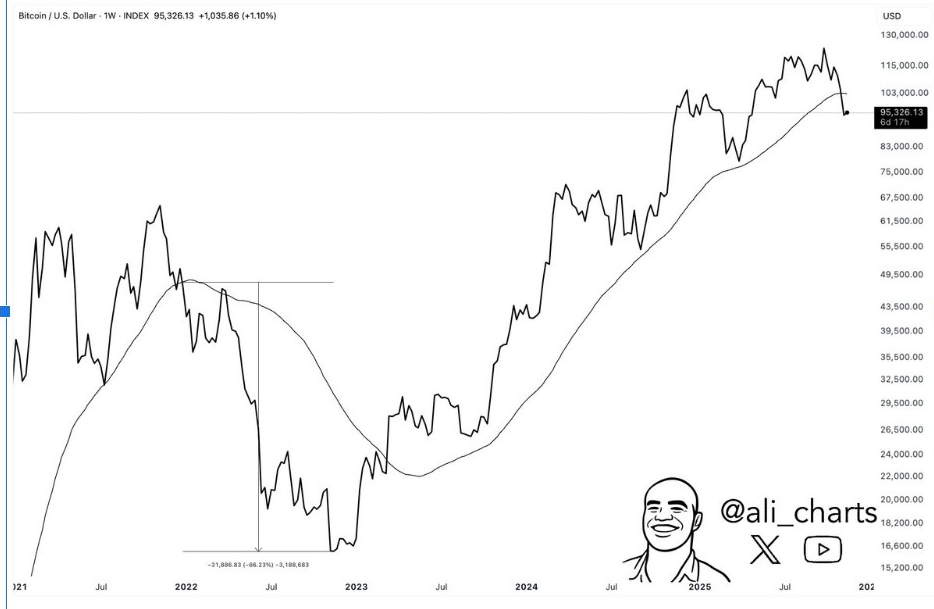
Ali highlighted that Bitcoin is now exchanging around the mid-$90,000 range with thin support until the low $80,000s. The slope of the long-term average is decreasing, which indicates low trend strength.
His comparison showed that a failure to reclaim the 50-week SMA could prolong the current correction. PepeSso compared the current correction with the previous cycle drawdowns. His chart showed three of those similar 30-33% pullbacks, with all followed by strong rallies.
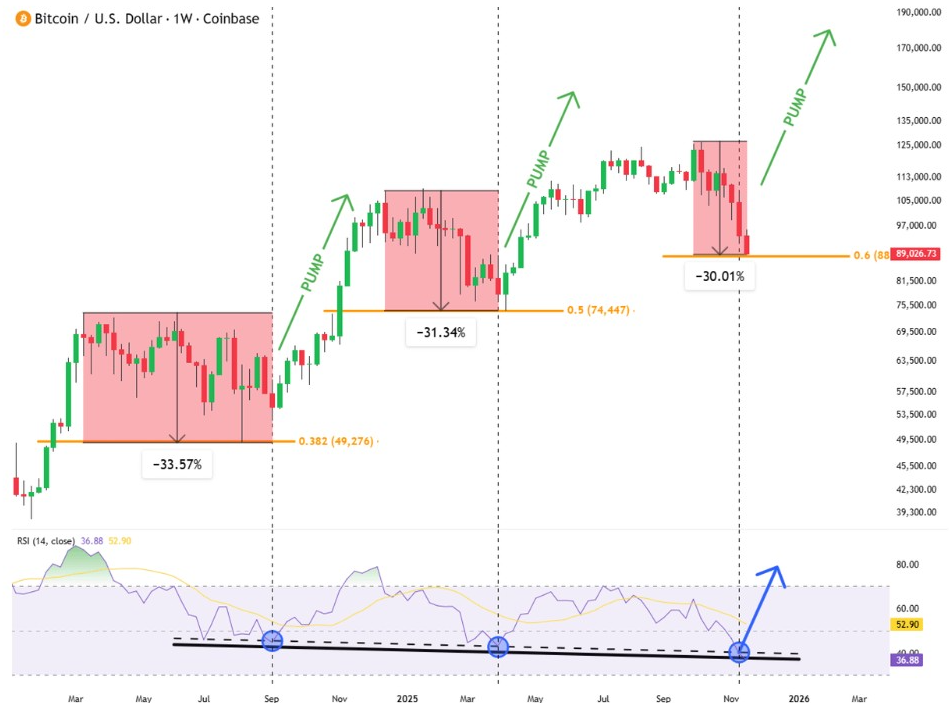
According to his data, the current decline fits right in with those sequences in the past. He suggests a breakout could go for $150,000 if the pattern repeats. PepeSso also highlighted an RSI inflexion zone, which appears at the same point of each major cycle low.
Liquidity Zones and Market Structure Shape Bullish Scenario
Meanwhile, market structure is still central to short-term expectations. Charts showed a very distinct green demand block between $90,000 and $93,600.
The Bitcoin price has bounced twice within this area, which confirms it as a high-value zone. The next liquidity cluster is around $96,700, which forms the main upside magnet.
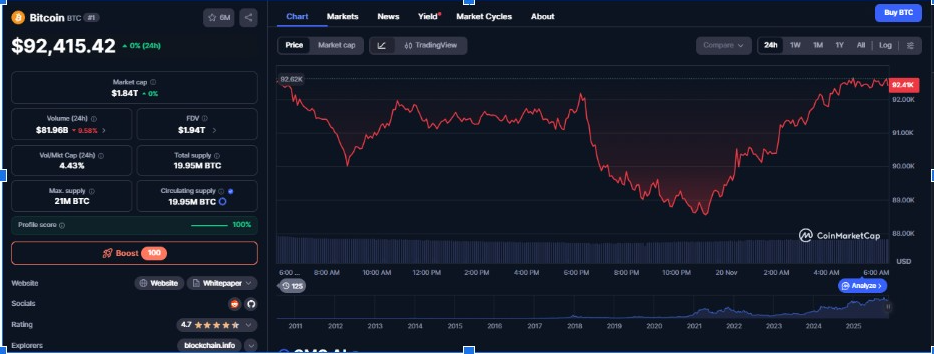
Volume data is also adding to the argument for a short-term bounce. CoinMarketCap data revealed a price recovery of $92,400 intraday, following a sell-off earlier in the day.
Although 24-hour volume dropped sharply, buyers are slowly absorbing panic selling. Analysts anticipate volatility to increase if it surpasses the $93,600 level, unlocking greater liquidity goals.
Additionally, the Bitcoin price continues to form higher lows on the lower timeframe RSI, while the price itself forms lower lows. This multi-session divergence is unusual during deep corrections. Analysts see it as a signal that sellers are losing momentum as the market moves towards discount zones.