Bitcoin
 Pearl
Pearl Starknet
 Zerebro
 NEAR Protocol
 Solana
 Quantus

Ethereum Classic price continues to lose significant structural levels as its long-term trend persists. ETC currently trades below key price zones that stood as the foundation for previous recoveries in 2023 and 2024.
There is an evident macro breakdown, which could result in ETC returning to deep support areas around $5. Although this is not a confirmation, the existing Ethereum Classic price figures indicate a continued decline in both price action and market share indicators.
Ethereum Classic Price Prediction: ETC Extends Its Multi-Month Breakdown
The three-day Ethereum Classic price chart shows a long-term decreasing trend that started due to the big increases of July 2023, March 2024, and June 2025. All the rallies yielded a lower high and failed to cross the broader resistance patterning between 23 and 26.
This old ceiling has thwarted all efforts to recover and strengthened the crumbling macro structure of the Ethereum Classic price.
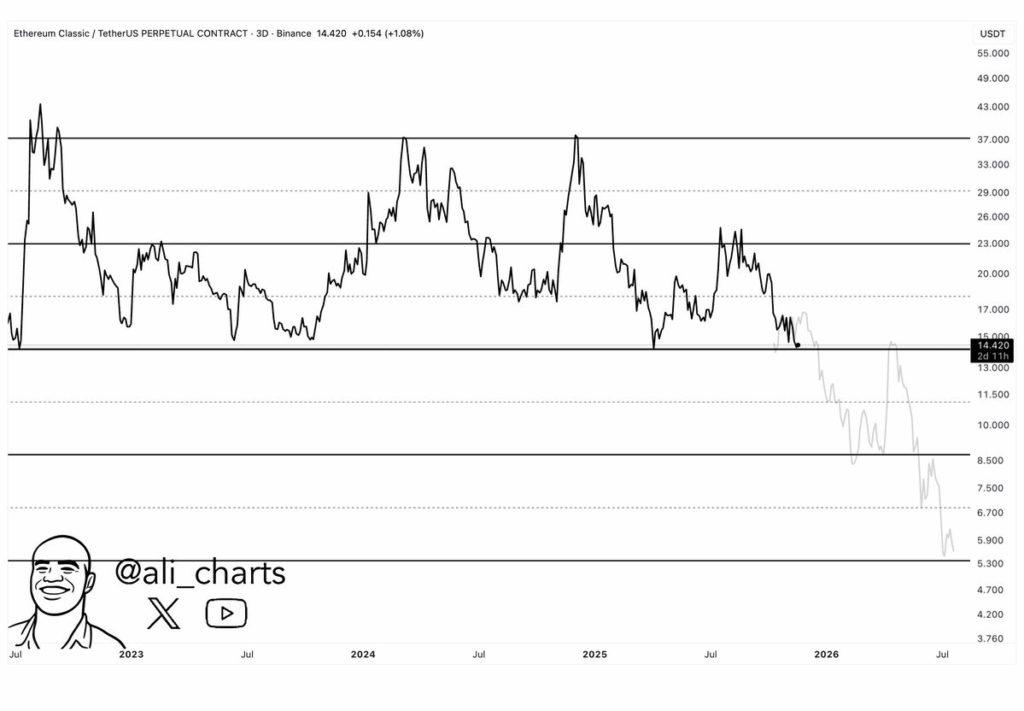
The asset is now trading at the level of about $14.20-$14.40. It is just below the previous support area of 15-16. This area served as a counterbalancing mechanism throughout multiple reversal attempts in 2023 and 2024, but has since shifted to opposition.
Losing this level leaves ETC in a structurally vulnerable position. The next significant historical demand area will not be reached until the $8.50 -6.00 area.
The estimated price trend indicated in the chart suggests a prolonged period of weakness until 2026. We can see a consistent decrease in prices to the mid-single-digits level during the period.
Although illustrative, it shows how badly ETC was losing its long-term structure. It lacks any clear levels of structural floors to which it could fall.
Ethereum Classic Price Prediction: Market Share Continues to Erode
Since the beginning of September 2025, ETC has been trading at approximately $18-$19. Its FDV did not decrease at any point during that period. The price and FDV were falling steadily as the selling pressure rose towards the end of September and October.
By mid-November, the price had tightened in the range of 14-15. The FDV decreased in tandem, which proved that the impairment of valuation and market demand went in the same direction.
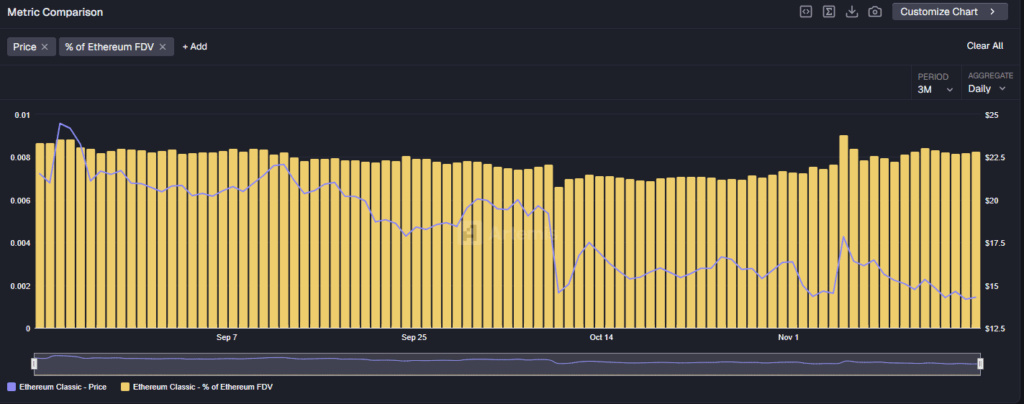
Late October and early November saw small spikes of volatility, but this short-lived trend change did not change the overall direction. The overall pattern of the price movement and FDV is a downward trend, signifying decreasing liquidity appetite. It shows decreased capital concentration around the asset.
Short-Term Charts Highlight a Tightening Downtrend
The four-hour chart highlights short-term problems with the Ethereum Classic price. ETC has been within a tight downward channel since the start of November.
All the efforts to pop out of the upper edge of the channel have been rejected. This has created a series of lower highs that serve to coincide with the weakening overall structure.
Ethereum Classic price has done so repeatedly. The zone that has been rebounded many times but has not given any momentum to create a lasting impact on the downward upper trendline.
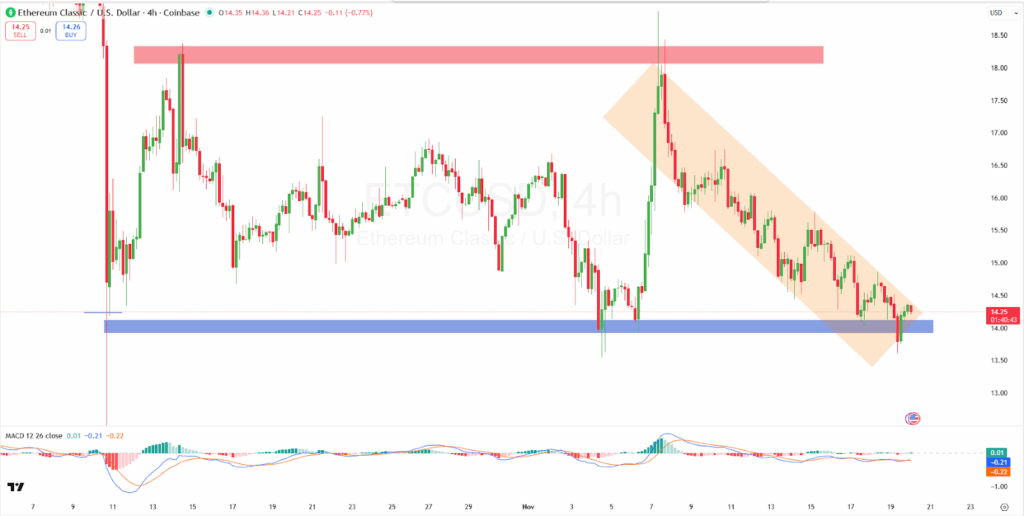
Repeat tests of this support indicate eroding buyer activity, particularly when ETC just went under the zone but was back in it. The MACD indicator for this period indicates a declining bearish momentum, yet it has not yet indicated a definite change.
Momentum is not increasing, reflecting the asset’s failure to mount a serious recovery in recent sessions.
The composite price and FDV measures of Ethereum Classic represent a long period of weakening. Constant decreases in the FDV share of ETC are yet another indication of the gradual shift in the market towards alternatives.