
 Bitcoin
 Aerodrome Finance
 Zerebro
 Starknet
 Zama
Zama Pearl
Pearl ZKsync

Altcoin markets are recovering as traders have been monitoring the early signs of a possible rotation. The altcoin season index remains low, but momentum indicators are shifting. Analysts now wonder whether a confirmed breakout could spark off a strong altcoin season in the near future.
Altcoin Season Index Approaches Breakout Levels
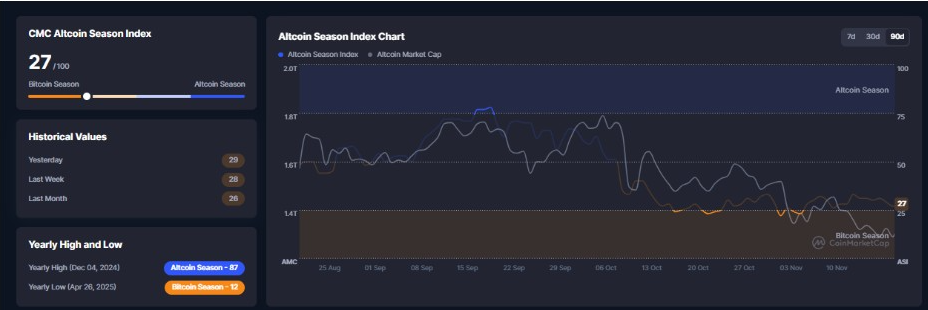
The altcoin season index was at 27 at press time, a clear signal that it is Bitcoin season. However, the weekly chart demonstrated dominance pressing a major falling wedge resistance, potentially indicating a trend shift.
Bitcoinsensus observed that such a breakout, which would be confirmed, could unleash additional upside for several mid-cap and small-cap assets. This arrangement is in accordance with increasing assurance in the altcoin markets after months of weak performance.
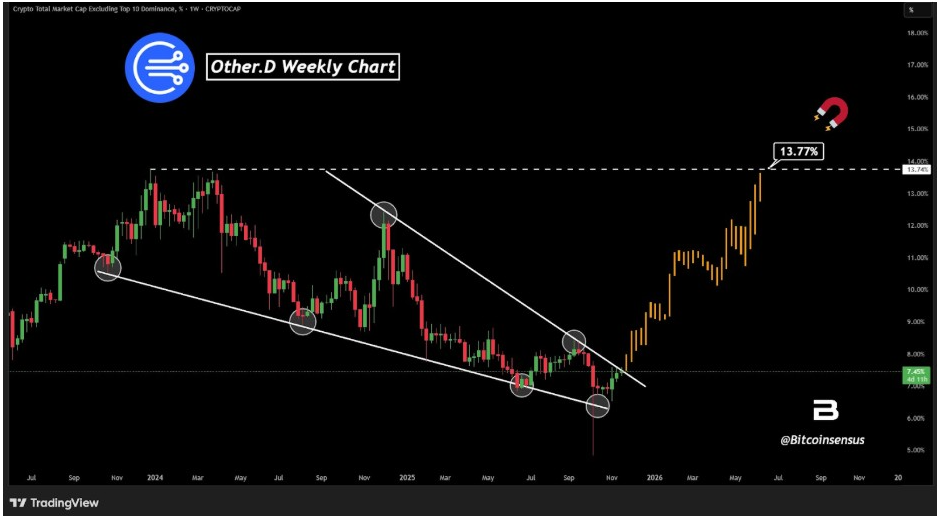
Furthermore, Bitcoinsensus pointed out a key zone near the 13.7% dominance. A break above that level would show a breakout from a multi-year wedge.
However, the analyst warned that rejection would mean more chop coming. This aligns with what is expected in the current altcoin season while traders await a structural shift.
MACD Signals Early Altcoin Strength
Michael van de Poppe said the market was flashing its best altcoin chart in 4 years. He referred to a huge bullish MACD divergence on the monthly timeframe.
According to him, this pattern last appeared in 2019 before a strong altcoin recovery. He also focused on the MACD crossing into positive territory for the first time in years.
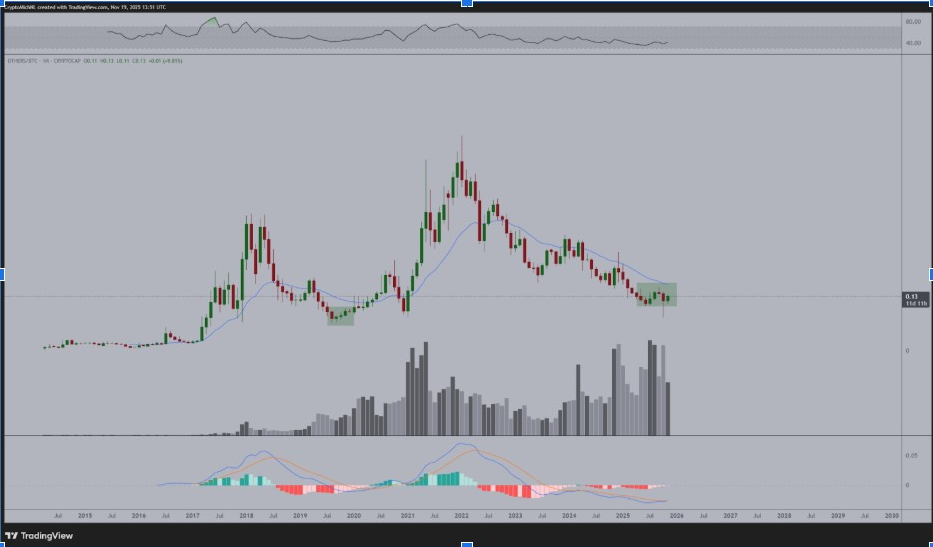
His chart indicated increasing volume and a stable price range. This combination is indicative of early accumulation activity in key altcoin segments. Poppe said the market was “starting up again” with conditions similar to early cycle periods. This potentially confirms the bigger picture that structural momentum is accumulating under the surface.
Historic Patterns Support Rotation
The altcoin season index showed that it was slow to rise from last month’s reading. However, as we see in historical charts, explosive expansions start from similar zones. Pepe Whale identified a repeating macro structure in the altcoin total market cap. Previous cycles brought gains of x267, x359, and x471 following Bitcoin’s peaking.
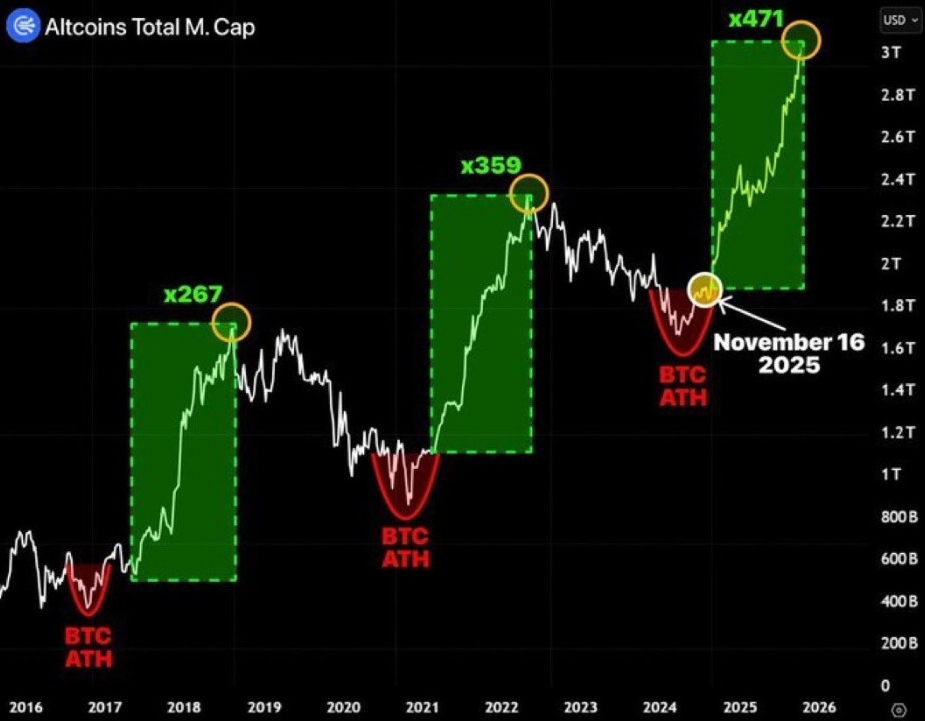
His chart had November 16 as a possible pivot. Each cycle saw altcoins bottom soon after Bitcoin’s cycle top. The most recent structure resembled former expansion phases, with green rising representing accelerated capital rotation. This pattern led to speculation that a new season of altcoins could be starting soon.
Pepe Whale suggested that volatility spikes following Bitcoin tops are historically very strong altcoin rallies. This timing coincided with the recent cooling of Bitcoin and increased awareness of mid-cap assets. If the cycle repeats, then the next expansion may exceed the previous returns based on his long-term model.
Market Structure Builds Momentum
CryptoMichNL went further to confirm this with the help of a wider market structure chart. He pointed out a pattern of falling over several years that reversed itself recently. The chart showed altcoins making their first green monthly bar in four years. This bar comes on the heels of extended selling pressure and a lengthy consolidation, both of which are commonplace in pre-season setups.
He emphasized the strong divergence across MACD and RSI. These indicators in the past have marked strong accumulation before major altcoin season rallies. Combined with the altcoin season index that is rising, this structure points to improving strength across the market. Per the analyst, the chart was “comparable to 2019,” which reinforces the rotation narrative.



