Bitcoin
 Pearl
Pearl Starknet
 Zerebro
 NEAR Protocol
 Solana
 Quantus

The Ethereum price is close to a significant technical move, having formed a large inverted head-and-shoulders pattern in the long term. The multi‑year price action shows a clear trend.
A left shoulder formed in mid‑2024, and a full head appeared in late 2024 to early 2025. A right shoulder is now forming in the last quarter of 2025.
The neckline is just in the $4,800 zone. The zone is where resistance was tested in 2021 and in early 2025 rallies.
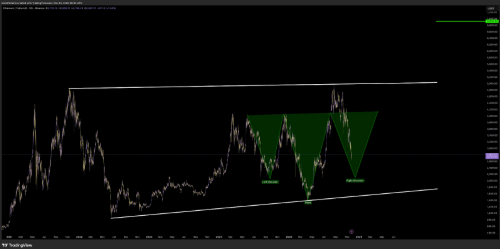
Ethereum price is currently attempting to establish a base above the $2,700-$2,900 range. This is the same area where Ethereum had several reaction points this year. The right-shoulder new low was at around $2,370, which is in line with the support within the intraday charts.
The inverse head-and-shoulders neckline at $4,800 remains the ultimate trigger point. We see a previous rally toward this, which happened between January to May 2021.
The move was followed by a recovery attempt in November 2021. After this, we saw an early-2025 breakout that reached above $4,700 before reversing.
Whale Accumulation Strengthens Bullish Outlook
Examining on-chain data, we observe renewed accumulation by large holders. FalconX recently transferred 21,537 ETH. It had a value of about $59.17 million, to a new wallet thought to belong to Bitmine. This acquisition builds on previous inflows to Bitmine.
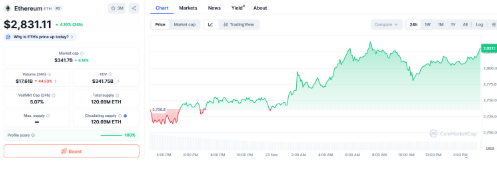
CoinMarketCap data shows that Ethereum was trading at 2,831 as of press time, a 4.16% increase over the day. ETH now sits in the upper range of its recent pullback. It rose from lows near $2,600 recorded earlier in the week.
More data from DeFiLlama shows that the total value locked on Ethereum was $65.7 billion as of press time. The data indicate a gradual increase in system activity over the past few months.
The metric is significantly lower than the all-time high in 2021. However, it is relatively stable based on the volatility of the market.
Ethereum Price Pushing for the $2,800–$2,900 Zone
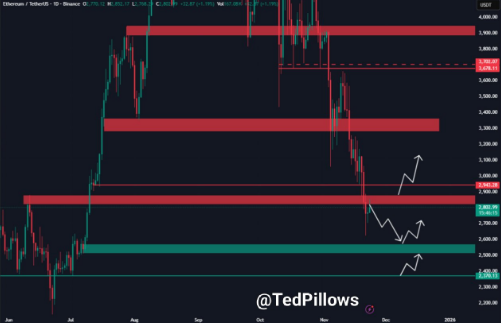
Additional chart data indicates that the Ethereum price is currently attempting to reclaim the 2,800 to 2,900 level. This zone served as structural support in August and once more in October.
The zone was, however, disintegrated in the November decline. Another effective turnaround would take ETH within the previous consolidation range.
The zone provides Ethereum with an opportunity to rise. The price could reach a liquidity pocket between $3,300 and $3,400. The red resistance blocks on the chart correspond to this region. This capped multiple daily candle tops during the September-October period.
Analysts are warning that today’s upward momentum on the Ethereum price could cause a gap in CME futures. Throughout the last five months, it has been able to fill one to two gaps per week.
The existing gap formation introduces an element of a possible short-term retracement action. However, it does not alter the broader trend, as identified on the multi-year chart.
A resounding reclaim of $2,900, continued action towards $3,300-3,400 would cement the right-shoulder shape. On the other hand, returning towards the range of 2,600 would contain ETH within the lower consolidation band.
The band has seen previous accumulation phases in May, June, and late 2025.