
 Doge Pepe
 Bitway
 Pons
Pons Sui
Sui Pearl
Pearl Ronin
Ronin Zcash
Zcash

Gold may be nearing a critical point as analysts speculate a price move below the trend support before a potential upward move. This sequence has previously been seen in the chart over time.
Meanwhile, Bitcoin‘s recent cup-and-handle breakout against gold signals a potential divergence. BTC is poised to outperform XAU in the coming months.
The Gold price slipped down towards the support line, and broke below it, then suddenly rose in October. We can see a deep wick penetrated support before the price reversed to the $4,300 level and above.
The Gold price is close to $4,044, having fallen from $4,450 earlier in the quarter. We can see a pattern of higher lows since early September. Based on the historical context, there is no chance that gold will continue to increase without creating a false breakdown.
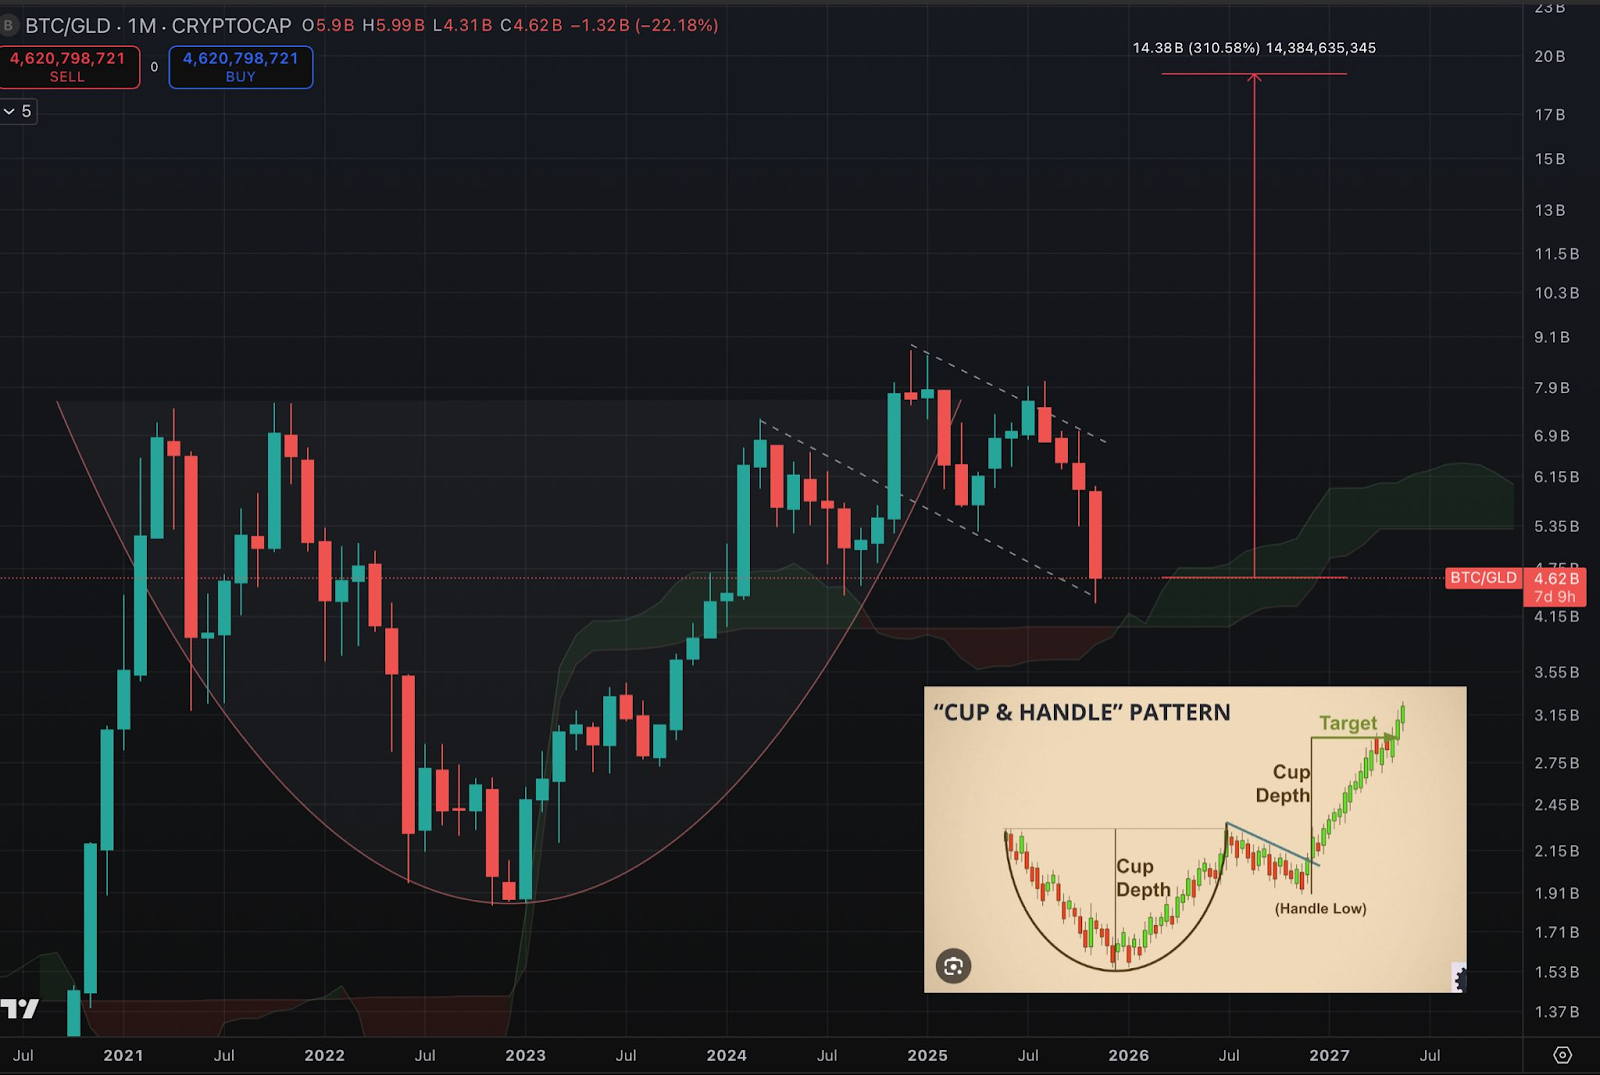
The trend also indicates the way the market has been moving since the fourth quarter of 2025. We see several intraday fluctuations have been checking demand areas within the same diagonal support.
Reaction lows keep rising on retests. This shows the market still values the structure highly. This is despite larger consolidation maturing before the next decisive action is undertaken.
Bitcoin-to-Gold Ratio Forms Multi-Year Cup-and-Handle Structure
The Bitcoin/Gold monthly ratio displays a larger dataset that spans over four years. The chart depicts a complete cup formation that begins at the peak of April 2021, all the way to 2024.
The bottom of the arch of the cup is rounded. It joined the major drop cycle to the following multi-year up trend. The move returned the ratio to the previous highs.
The ratio is now at the lower part of that channel at about 4.6B. The zone is usually referred to as a pivot zone, normally appearing in late-stage handle formations.
The neckline is close to the 6.1B point, and the projection of the measured move of the cup is upward by approximately 310%. This is based on the technical parameters of the pattern. They are identical in scale to the depth of the cup and the extension of the projected breakout.
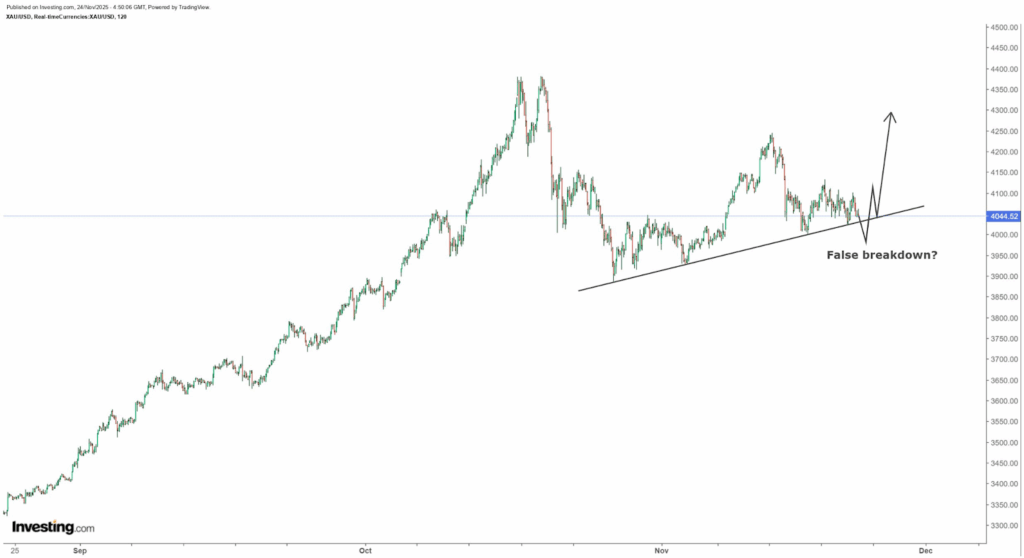
The building is representative of two huge market periods. The drop in November 2022 to the low in 2021 formed the left half of the cup. On the other hand, the gradual improvement between 2023 and 2024, and the first part of 2025, formed the right half.
The decreasing trend of the handle is an indicator of less volatility in a long-term maturing trend. The low volatility will culminate in a future breakout effort upon completion of the consolidation process.
The technical formations do not dictate any results. However, the pattern offers an organized perspective of the comparative performance of Bitcoin and gold over a multi-year period.
Policy Commentary Provides Wider View of Bitcoin /Gold Dynamics.
Price action and the emerging pattern coincide with talks of a U.S. Strategic Bitcoin Reserve. Senator Cynthia Lummis’s proposal adds weight to the market narrative.
It means the U.S. would liquidate its gold certificates at current market value. The profits would then be shifted into Bitcoin, keeping the money supply unchanged.
The law is not clear on the feasibility. However, the concept adds another macro dimension to the relationship between BTC and gold.
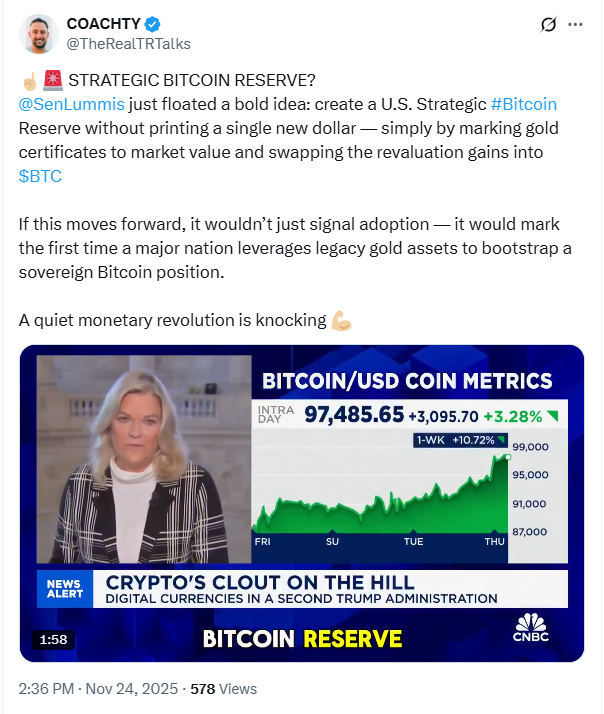
The discussion is not directly relevant to the technical structures shown on the charts. It sets the policy context as the BTC/Gold ratio nears a multi‑year inflexion.
The market reacts to this alignment with heightened attention. Policymakers may extend such orientation into broader allocation frameworks. Gold and Bitcoin could become central to long‑term portfolio strategies.




