Zylo Ecosystem
 Walrus
 Pudgy Penguins
 Pearl
Pearl Bitcoin
 Aerodrome Finance
 Quantus

SEI crypto price trades near a critical support level after weeks of steady decline. Investors now watch several new technical indicators that could influence the trend ahead. Analysts see mixed conditions, but with specific structures that suggest possible early strength.
SEI Crypto Price Faces Crucial Double-Bottom Test
Ali pointed out a forming double bottom pattern on the three-day chart. The structure needs for SEI to bounce off the present level to establish a reversal. His chart has two rounded lows forming throughout 2025, with a possible neckline around $0.38. If there is a strong reaction from the price, it could trigger activation of this pattern in early 2026.
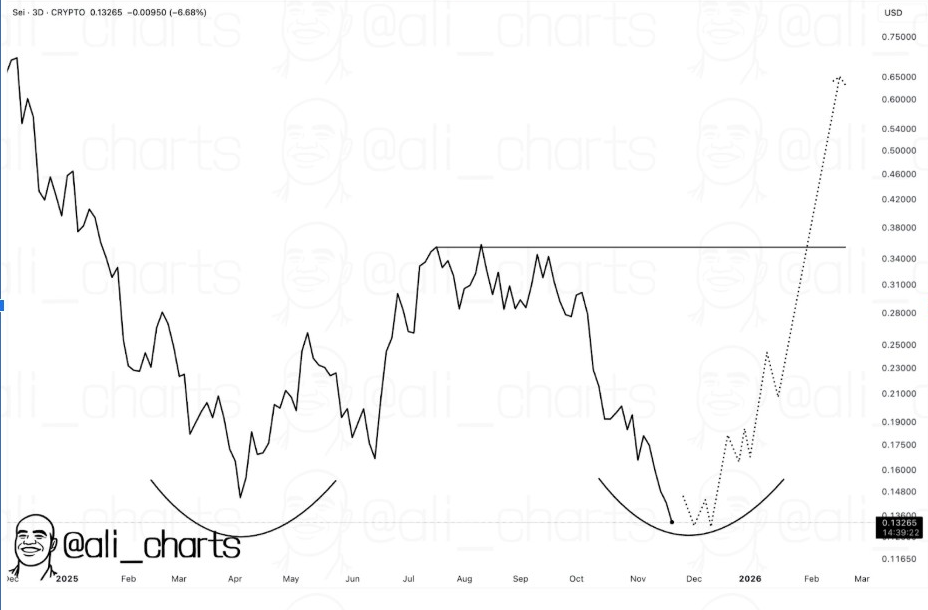
Ali’s projection had a dotted breakout path targeting the $0.60-$0.70 region. This would require a consistent upward movement and stable market conditions.
The pattern is also suggesting fading down pressure after months of weakness. Since double bottoms are often signs of exhaustion, traders now pay attention to the question of whether buyers defend such a zone.
Higher Timeframe Signals Hold Despite Daily Failure
Furthermore, Ali also noted that SEI crypto recent daily buy signal was invalidated through continued selling. However, he stressed that the weekly and bi-monthly TD signals were still active.
These higher time frame indicators play out over a longer period of time. They may still be in favor of a stronger rebound phase if market sentiment stabilizes.
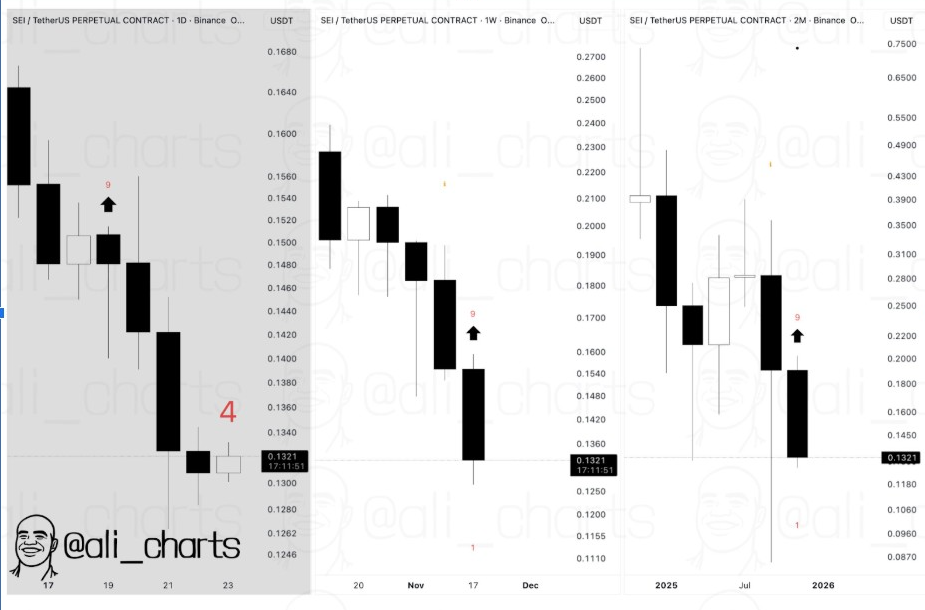
The weekly chart has a completed TD 9 candle near the support band. Meanwhile, the bi-monthly timeframe shows yet another potential exhaustion marker developing with long down pressure. Because these signals tend to lead to circumstances sanctioned in trend shifts, traders are constantly watching long-term momentum.
Moreover, confirmation requires SEI crypto to retake previous areas of resistance. Until then, volatility is likely.
Rotation Signals Getting Strong as Bitcoin Pauses
A different view is taken by Michael van de Poppe, who examined the BTC pair by SEI. He argued that SEI is displaying strength against Bitcoin in the latest drop. His chart shows a wide support area with buyers stepping in previously. This area has been maintained through several retests over several months.
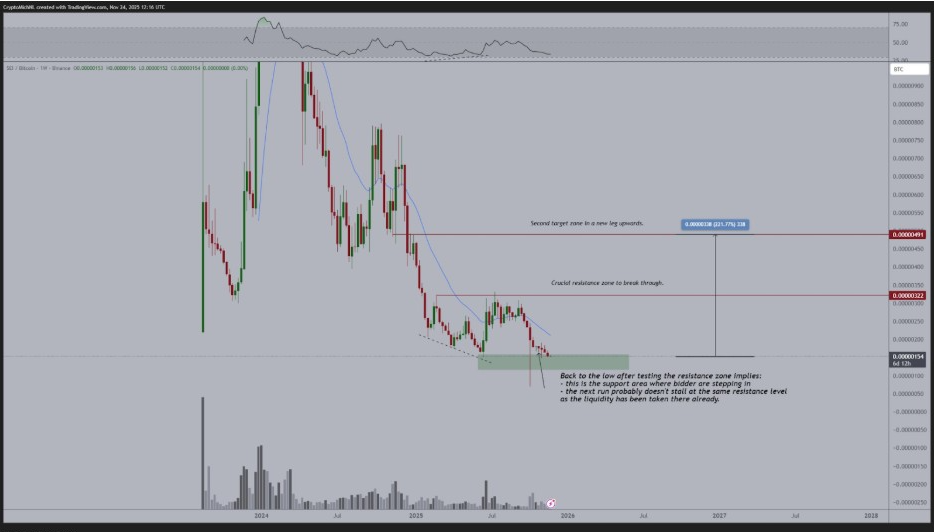
Van de Poppe said that SEI could rotate dramatically if Bitcoin rallies. He also said that the next range of resistance is far above current levels. If rotation is increased, swings could rapidly move from the previous liquidity removal. Therefore, he identified this area as a good entry area for swing traders. The setup is dependent on a broader market momentum, but conditions are supportive.
Perpetual Surge in Volume Indicates Speculative Activity
Additional data from Marc Shawn Brown showed that SEI perpetual futures volume tripled in the last 30 days. His chart showed recurring $40-$60 million spikes throughout November. Increased derivatives activity is often indicative of increased speculation or hedging.
Because volume was rising while the spot price was weakening, the market sentiment remains mixed. Some traders have been anticipating a nice bounce, while others are hedging against deeper losses.
The increased activity reinforces SEI’s position as a high beta asset. If there is a rebound, volume could amplify the move greatly. But high speculation can also mean higher downside risk.