NEAR Protocol
 Bitcoin
 Aerodrome Finance
 Pearl
Pearl Uniswap
 Quantus
 Pudgy Penguins

After months of downward pressure, Dogecoin price is showing signs of a trend reversal as traders have noted a change in its structure on several timeframes. Analysts say DOGE could be preparing for a broader recovery if bulls continue defending key support. The long-term outlook points toward a return to the $0.40–$0.50 region if momentum improves.
Dogecoin Price Setup Confirms Early Uptrend Formation
According to analysis from Trader Tardigrade, Dogecoin price has broken above a long-standing descending resistance on the 4-hour chart. The move followed the formation of an ascending triangle near the lower trading range, signaling that buyers were consistently stepping in at higher lows. This price compression helped weaken the bearish trendline that capped DOGE’s rallies.
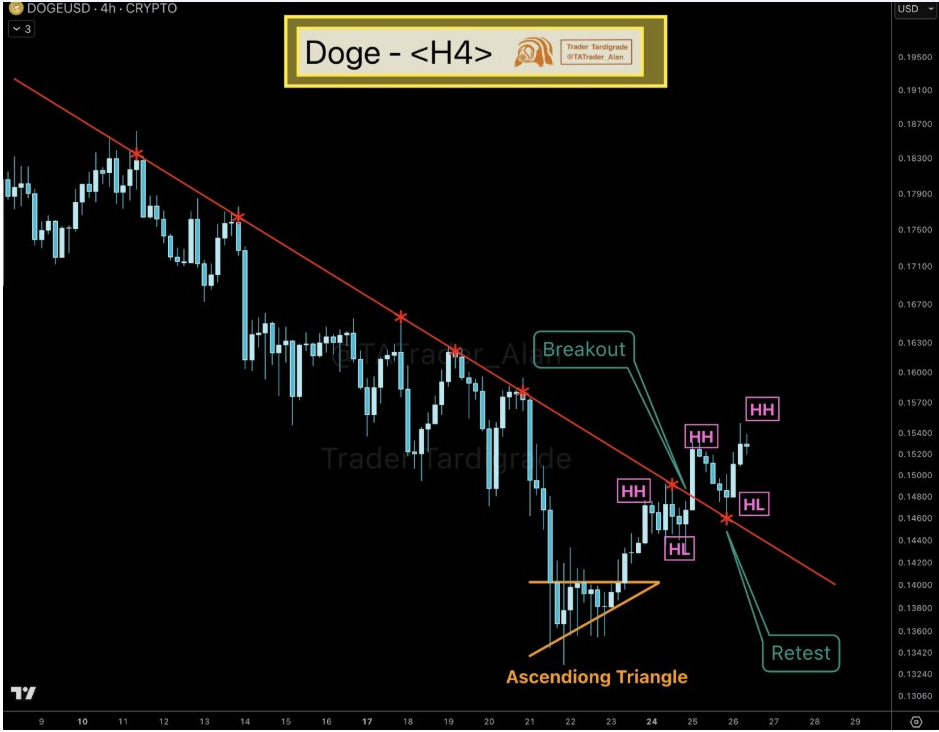
The trend change was solidified with DOGE retesting the former resistance level as support after the breakout. Another series of higher highs and higher lows now points to the initial stage of bullish structure. Analysts are wary, however, that further continuation would be required above current swing highs to sustain the Dogecoin price turnaround.
Key Reversal Zone Could Launch Upside Toward $0.50
In the meantime, analyst Crypto GVR indicated a significant reversal zone between $0.10 and $0.155. This zone has been in strong demand in the past, and buyers have defended it at $0.08-$0.10 when the market is in a drawdown. Current consolidation suggests that the downward force may be decreasing, despite its decline from April, which reached a high of $0.48.
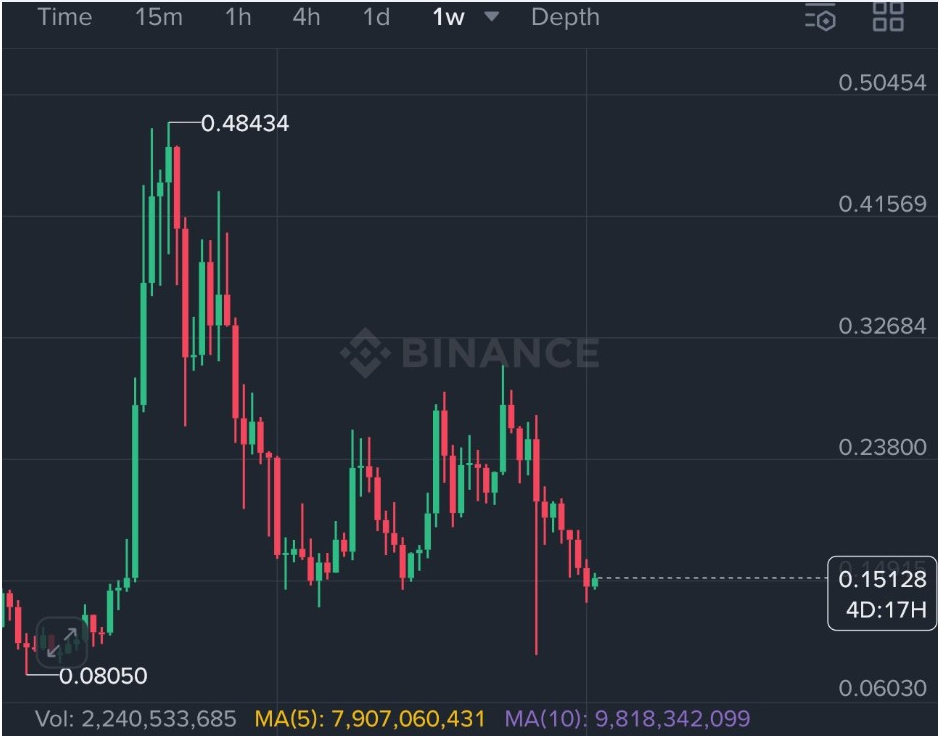
Maintaining a price above $0.10 is considered the most critical requirement for the bullish thesis to remain intact. Crypto GVR’s long-term Dogecoin price prediction targets a return to the $0.40–$0.50 zone if resistance levels at $0.24 and $0.33 are reclaimed with strong trading volume. Improved market sentiment or fresh utility-driven speculation could speed up that recovery.
Indicators Signal Stabilization
Recent analysis of Dogecoin’s chart indicates that the cryptocurrency has been weak since mid-September until late November, with the Dogecoin price remaining in the range of $0.15. The structure in the lower time frame suggests caution, as the decrease in volume also indicates weak conviction among buyers. The wider range implies that the asset is neutral and is waiting to have a stronger catalyst.
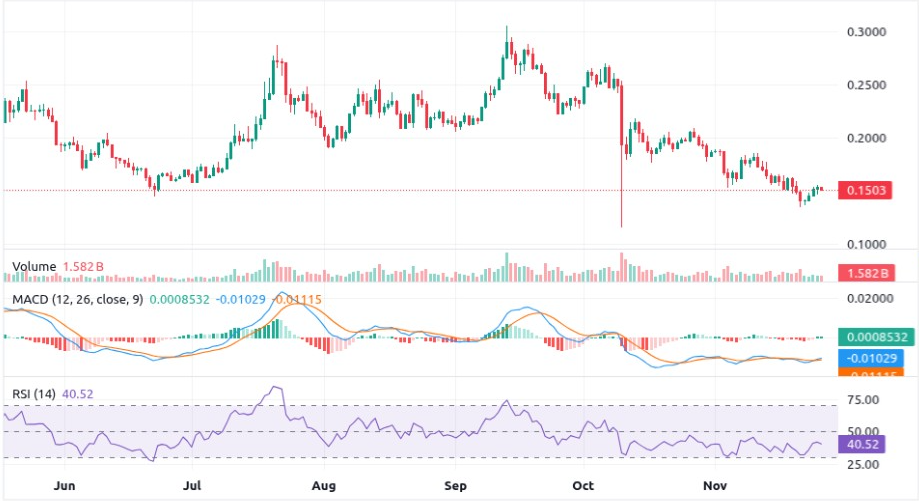
This uncertainty is also reflected through technical indicators. The MACD has already indicated bearish curves, but it is still below the zero mark. An RSI of about 40 would indicate that sellers are becoming weak but not exhausted. An upswing above the $0.17-$0.18 zone, accompanied by a surge in volume, would be an early signal of a significant shift in the market’s direction.
Inverse Head and Shoulders Adds to DOGE Price Bullish Case
In another setup, Trader Tardigrade emphasised an Inverse Head and Shoulders pattern on the 4-hour chart. The neckline breakout was accompanied by strong bullish candles, which were backed by a significant rise in the volume of purchases. The trend typically represents a significant turning point once substantiated by the price action at the neckline.
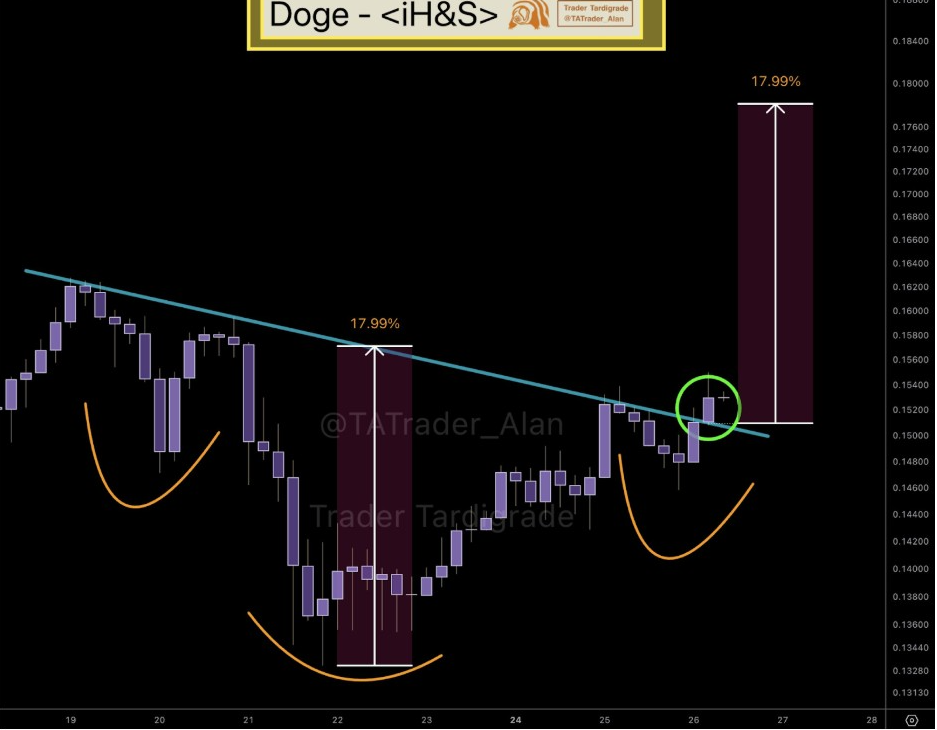
The technical target for the structure is approximately $0.178, which represents an 18% upside from the breakout level. Analysts suggest that the trend will persist as long as retests on the neckline continue to find support. If the momentum increases, Dogecoin price may climb to the higher resistance zones quickly than anticipated.
As of the time of press, DOGE price is trading at around $0.15, with traders watching for confirmation signals that could validate a breakout toward the $0.40–$0.50 zone.