
 Zylo Ecosystem
 astronaut
 Pearl
Pearl Walrus
 Starknet
 Pudgy Penguins
 Bitcoin

Ethena price has been on a steep decline since breaching its current support level. Market data indicate that the asset is at a monthly downward movement resistance point.
ENA reacted again in the $0.24–$0.22 region. This marks its third major retest of the base in 14 months. The token fell at a steady pace after reaching its high point in September.
A clean tap of the support band followed the move. It’s a move seen in September 2024 and July 2025 when bulls dominated markets.
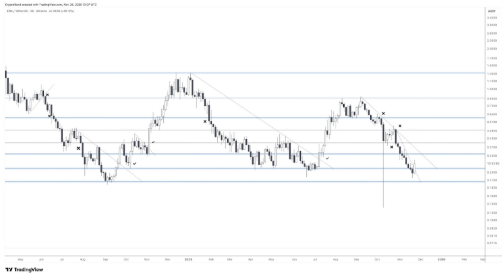
The 3-day chart shows the compression of the Ethena price in a tightening downward channel during October and November 2025. We also see a series of lower-high rejection occurring along the downward trend line.
ENA’s sharp wick into the support zone shows immediate absorption, a rebound back toward $0.29. That represents an over 20% pump from the intraday low, putting Ethena at the one-year downtrend resistance.
The zone that was defended also coincides with the same accumulation zone where ENA found a bottom in August 2024. Then, a sustained multi-month rally followed. That action propelled the token from the $0.23-$1.04 range to new highs near the beginning of January 2025.
Ethena Crypto Historical V-Shaped Recoveries Highlight Strong Reaction Behavior
More data from analyst Ali reinforces ENA’s history of sharp V-shaped reversals from major lows. The chart indicates two prominent recoveries; the first occurred in September 2024.
At that time, the Ethena price emerged from the area around 0.22 and rose by more than 495% to a peak of $1.04. In mid-2025, ENA fell back to the $0.24–$0.25 region. That decline set the stage for a sharp rally.
The price then surged 234% into the $0.65–$0.70 region. The two reactions were both brought about through the same price floors. Ethena price has once more gone back to the price floor.
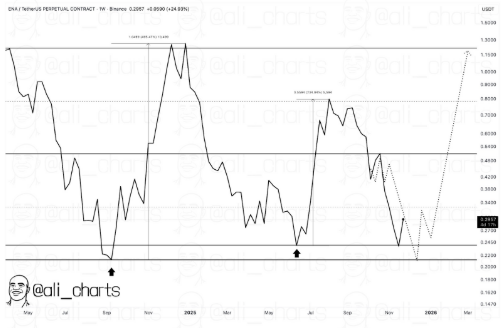
The chart highlights a clear declining trend line. It starts from the $0.85–$0.90 peaks at the end of summer 2025. The two attempts to exit the trendline in September, October, and early November were met with lower-high rejections.
ENA is now on the fourth attempt towards the same price line. The price is just under the same price line after the rebound on its support.
A break above the channel would shift the structure for the first time since the mid-2025 top. Intermediate resistance levels are at $0.32, $0.37, $0.43, and $0.50, past reaction zones and consolidation in past cycles.
Fib Structure and Additional Analyst Targets Add Context
The 3-day Ethena chart shows a high-to-low retracement. The price touched the 1.0 Fib level at $0.2228. It rebounded directly from that level.
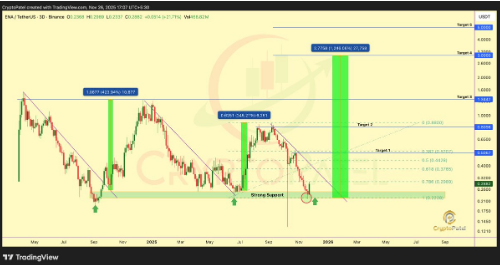
Intermediate Fib levels are above the present price, intersecting historical reaction levels. The levels include 0.786 level at about $0.2989, the 0.618 level at about $0.3765, and the 0.382 level at $0.5207.
These levels match the intermediate resistances in the primary technical framework. Historical data shows expansions of 423% and 245% from the same support region, a reference to earlier multi-month rallies.
In each of the three analyses, the most consistent aspect is the defence of the $0.24 -$0.22 zone by ENA. The main chart shows Ethena testing the monthly downtrend resistance again. This level has capped its price for months.



