
 astronaut
 Walrus
 Pearl
Pearl Bitcoin
 NEAR Protocol
 Zcash
Zcash Hyperliquid

Solana ETFs experienced their first outflow in 21 trading days with $8.10 million in net redemptions on November 26.
Data from SoSoValue shows the exit ended the longest consecutive inflow streak since product launches. Trading volume reached $50.61 million, with total net assets standing at $917.99 million.
Individual provider performance showed mixed results, with 21Shares TSOL recording the largest outflow at $34.37 million. Bitwise BSOL attracted $13.33 million in inflows, leading to positive flows.
Solana ETF Records First Outflow After Three-Week Streak
The November 26 outflow was the first negative day for Solana ETFs since the products began their 21-day positive run.
SoSoValue data shows daily net inflows consistently positive from early November through November 25. The $8.10 million withdrawal is 1.3% of cumulative inflows.
Total net assets dropped from $888.25 million on November 25 to $917.99 million.
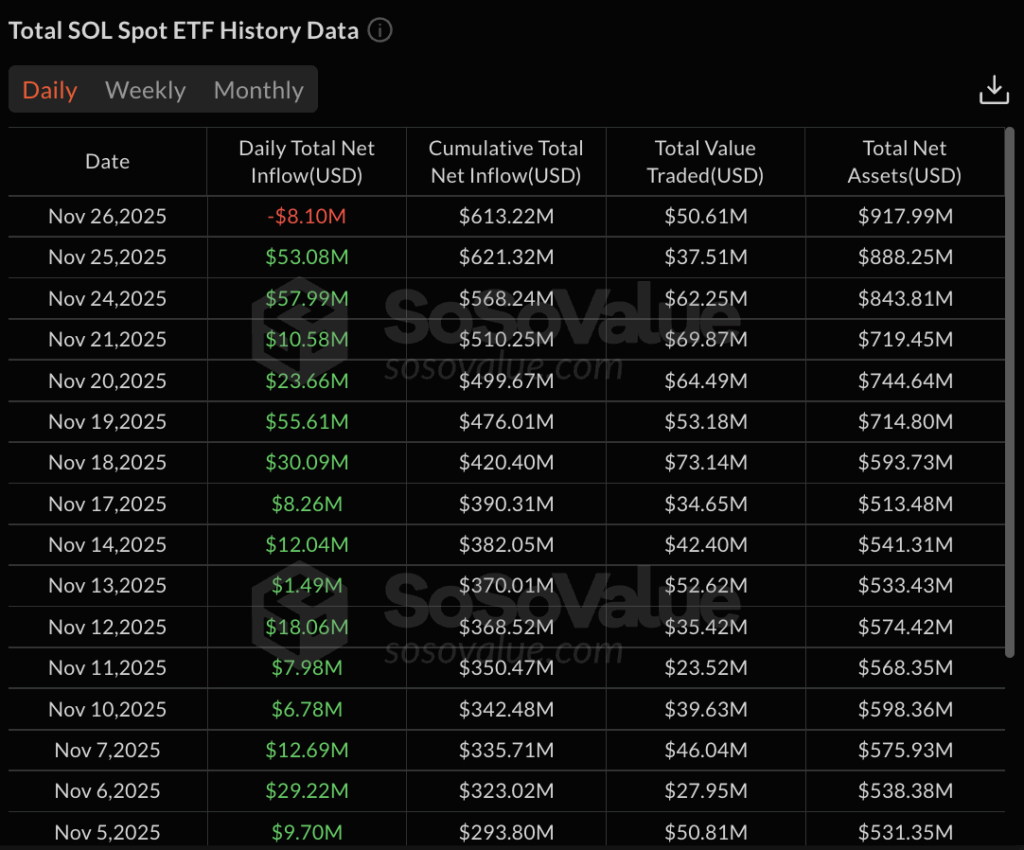
Trading volume of $50.61 million on November 26 fell below recent averages. November 25 recorded $37.51 million in volume, while November 24 showed $62.25 million. The November 21 session peaked at $69.87 million, which is the highest recent activity.
Cumulative total net inflows peaked at $621.32 million on November 25 before declining to $613.22 million. The products launched in late October with initial cumulative flows of $69.45 million on October 28.
Provider Performance Shows Mixed Activity
21Shares TSOL on CBOE dominated outflows with $34.37 million in redemptions and 240,120 Solana withdrawn. The fund maintained $86.92 million in net assets. Cumulative flows for TSOL turned negative at $26.22 million.
Bitwise BSOL on NYSE led inflows with $13.33 million contributing 93,170 Solana to holdings. The fund holds $631.20 million in net assets, representing the largest product by size.
Grayscale GSOL on NYSE added $10.42 million with 72,840 Solana entering the fund. Total net assets stand at $148.28 million with cumulative inflows of $73.50 million.
Fidelity FSOL on CBOE contributed $2.51 million with 17,550 Solana added to holdings. Net assets total $34.74 million with cumulative inflows of $29.89 million.
VanEck VSOL on NASDAQ and Canary SOLC on NASDAQ both recorded zero flows. VanEck holds $15.76 million in assets while Canary maintains $1.10 million.
Historical Context Of 21-Day Positive Flow Period
The 21-day inflow streak began in early November with consistent daily positive flows. November 25 recorded $53.08 million. November 24 showed $57.99 million and was the second-highest single-day total. On November 6, it peaked at $29.22 million during the streak.
Daily flows ranged from a minimum of $1.49M on November 13 to a maximum of $70.05M on November 3.
Total net assets grew from $288.92 million on October 28 to $917.99 million on November 26. The $629.07 million increase shows both net inflows and Solana price appreciation.
Assets peaked at $888.25 million on November 25 before declining slightly. Trading volume varied from $23.52 million minimum on November 11 to $79.50 million on October 29.
Cumulative inflows expanded from $69.45 million at the October 28 launch to $621.32 million peak on November 25.
October ended with $199.21 million cumulative on October 31. November 3 reached $269.26 million. Mid-November saw cumulative flows exceeding $400 million milestone. Late November crossed $600 million threshold before the November 26 reversal.
Analysts Project Recovery Despite Short-Term Weakness
Analyst Gordon maintained a bullish Solana outlook, citing on-chain activity and ETF inflows. The post referenced the inflation reduction proposal as a positive catalyst.
Gordon stated $500 Solana remains possible by 2026 despite current consolidation. The target is a 257% gain from the current $140 levels. Most on-chain activity and big ETF inflows support a higher price thesis.
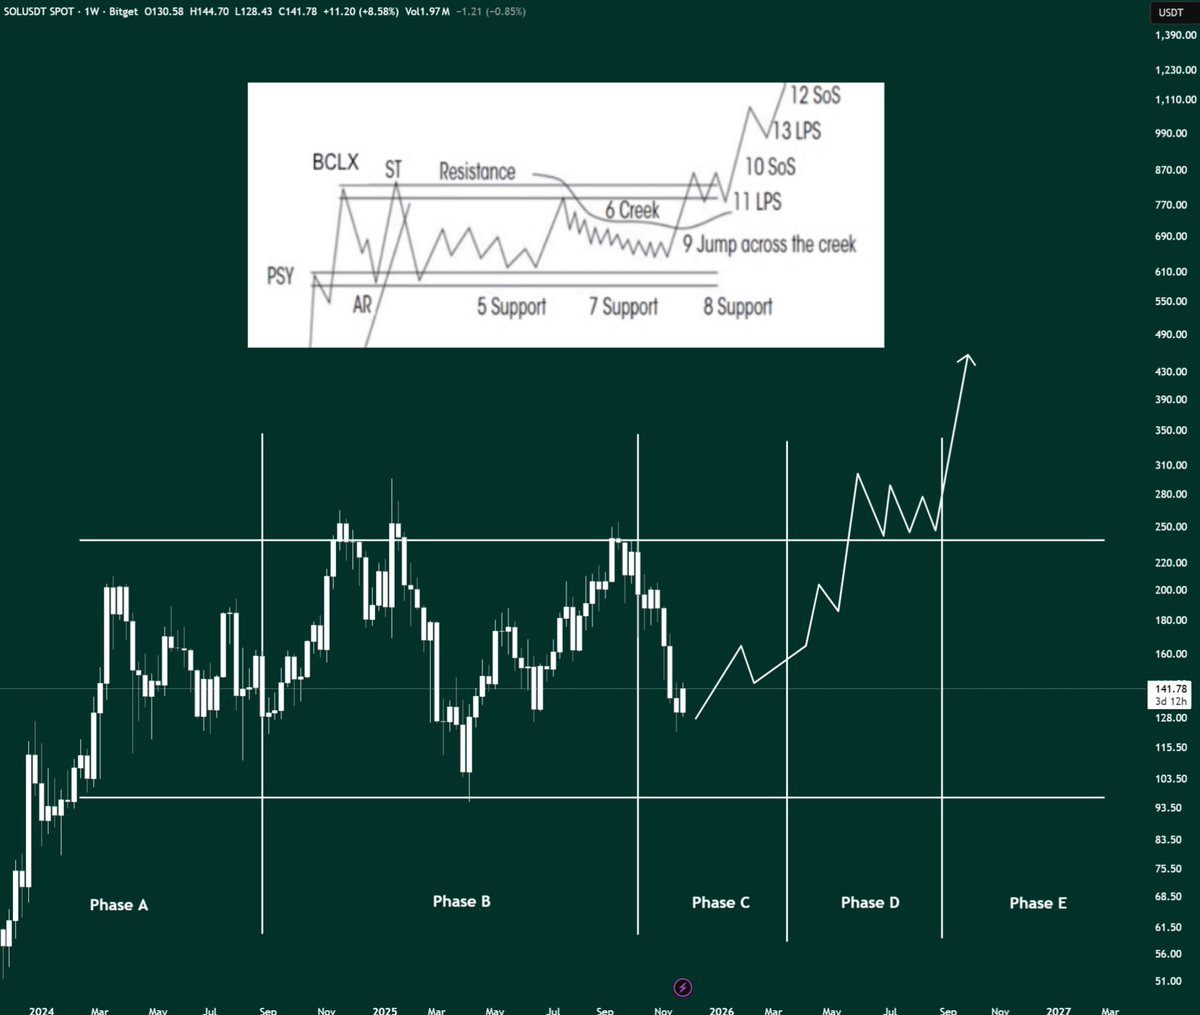
The Crypto GEMs identified Solana bouncing from the key demand zone at $121.66. The analysis stated buyers stepped in aggressively at the support level.
Current trading at $140.82 shows strength building toward $144 resistance test. A break above $144 could cause a surge toward higher targets.
Support levels identified at $138, $130, and $121. Resistance zones are located at $144, $152, $163 and $174.
Solana price performance shows mixed timeframes with 12.0% seven-day gain contrasting 27.6% monthly drop.
Price recovery from the $121.66 support to the current $140 is a 15% bounce. The resistance test at $144 is the next level deciding continuation or rejection.




