
 astronaut
 Walrus
 Pearl
Pearl Bitcoin
 NEAR Protocol
 Zcash
Zcash Hyperliquid

Cardano price saw a sharp jump in active supply while the token near a key demand area. Short-term pressure from rising circulation contrasts with a chart pattern that, in previous cycles, preceded strong rebounds. The mix of on-chain and technical signals now draws attention to whether Cardano price prediction is nearing a turning point.
Cardano Price Prediction: Short-Term Pressure Near Demand Zone
On-chain analyst Ali reports that ADA circulation climbed sharply in recent sessions. His chart shows repeated daily spikes in tokens entering active supply through November and early December. Each spike aligned with local pullbacks in Cardano price, forming a clear negative relationship between circulation and price.
Cardano circulation has increased again, indicating persistent short-term selling pressure. More tokens being moved between wallets and exchanges typically indicate increased trading activity and a higher likelihood of profit-taking. As a result, bullish momentum may struggle to build while these circulation surges continue.
At the same time, ADA price has rallied more than 10% in the last 24 hours. The recovery occurs while the token is still trading within a multi-month descending channel. This move suggests that, despite near-term selling pressure, buyers remain active near current levels.
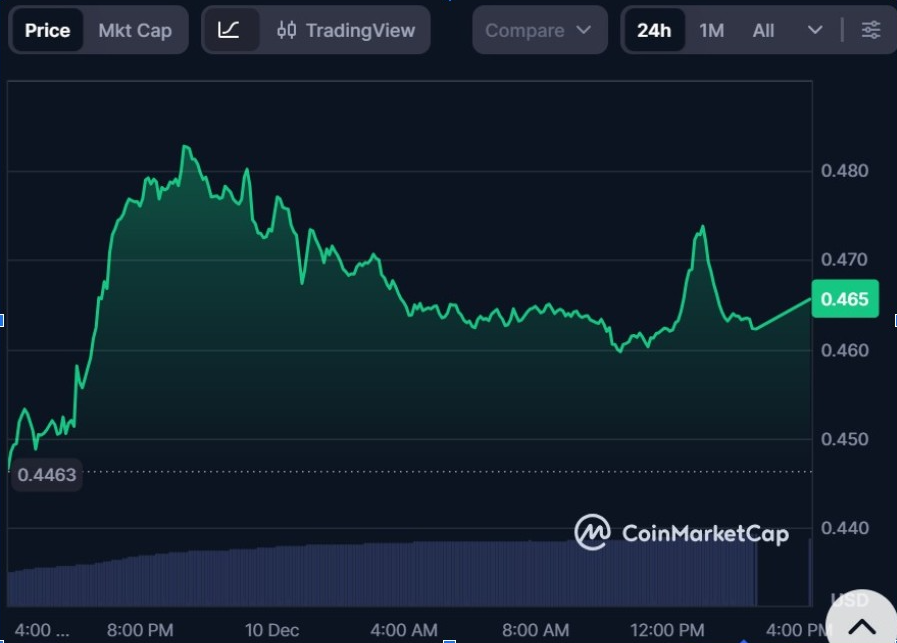
Notably, ADA token price now sits close to a demand zone near the lower boundary of that channel.
ADA Descending Channel and Breakout Targets
Meanwhile, analyst Lucky ADA price prediction showed a descending channel that has contained Cardano’s trend since August, with a sequence of lower highs and lower lows.
ADA remains inside this multi-month channel, but price is now positioned near the demand zone where previous bullish reversals began. Lucky’s chart marks earlier episodes, in April and July, when ADA broke above similar descending structures. Those moves led to strong upside extensions once resistance lines gave way.
In the current structure, the upper boundary of the channel acts as the first barrier for buyers. A confirmed breakout above that level could open a move toward the $0.90–$1.10 region. Lucky’s projection extends to a further target near $1.30 if momentum strengthens after the initial breakout.
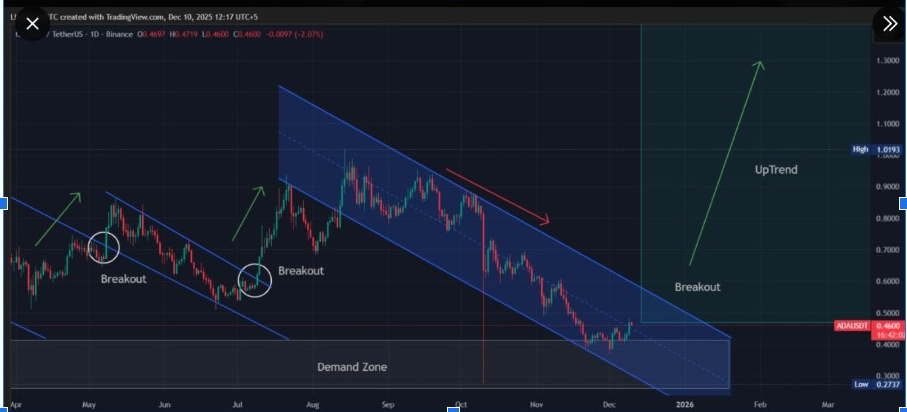
The pattern suggests a maturing downtrend rather than fresh weakness. While the channel remains intact, the repeated tests of lower support zones show a market that may be preparing for a directional shift.
ADA Token Near a Potential Turning Point
Taken together, the two readings frame ADA’s position in clear terms. On-chain, increased circulation pressures the token in the near term and keeps traders alert for further selling. On the chart, ADA trades near a demand zone that preceded strong advances, with a clear technical path toward $0.90–$1.10 if a breakout develops.
Additionally, ADA token remained bullish despite today’s minor pullback near $0.46.
The altcoin price continues to trade above recent lows, with buyers defending the $0.43–$0.44 support region on the daily chart.
The MACD lines are turning higher with expanding green bars, showing strengthening upside momentum after a prolonged decline.
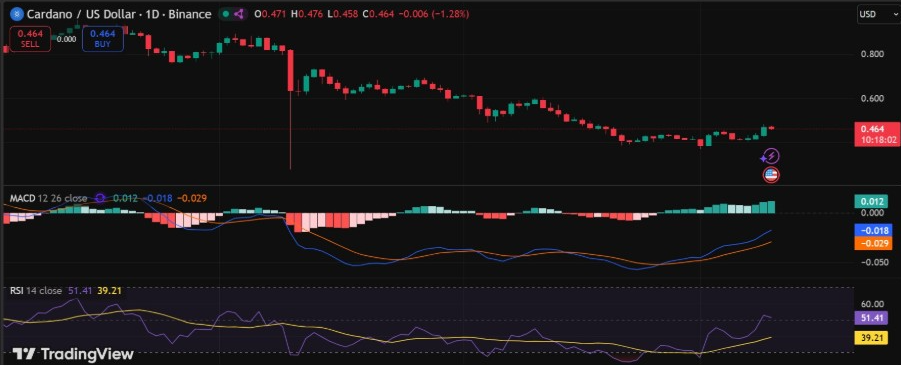
RSI has moved above 50, indicating an improving trend strength as ADA works to establish a more stable recovery structure.
Moreover, a recent Cardano price prediction indicated that the $0.50–$0.54 support band acted as a base in 2025, with rebounds in May and July forming near this level. At the same time, ADA remains capped by a long-term trendline from the $1.15–$1.11 region. This leaves ADA near the lower edge of its multi-month range as traders watch for the next move.



