
 Zylo Ecosystem
 Walrus
 Bitcoin
 Sui
Sui Quantus
 Quant
Quant Starknet

Chainlink price has plummeted and moved to a local bear market, moving from a high of $31 in November last year to the current $12.5. LINK has slowly formed a risky chart pattern, pointing to more downside as its demand in the spot, ETF, and futures markets falls.
Chainlink Price Technical Analysis Points to a Dive if a Key Support Fails
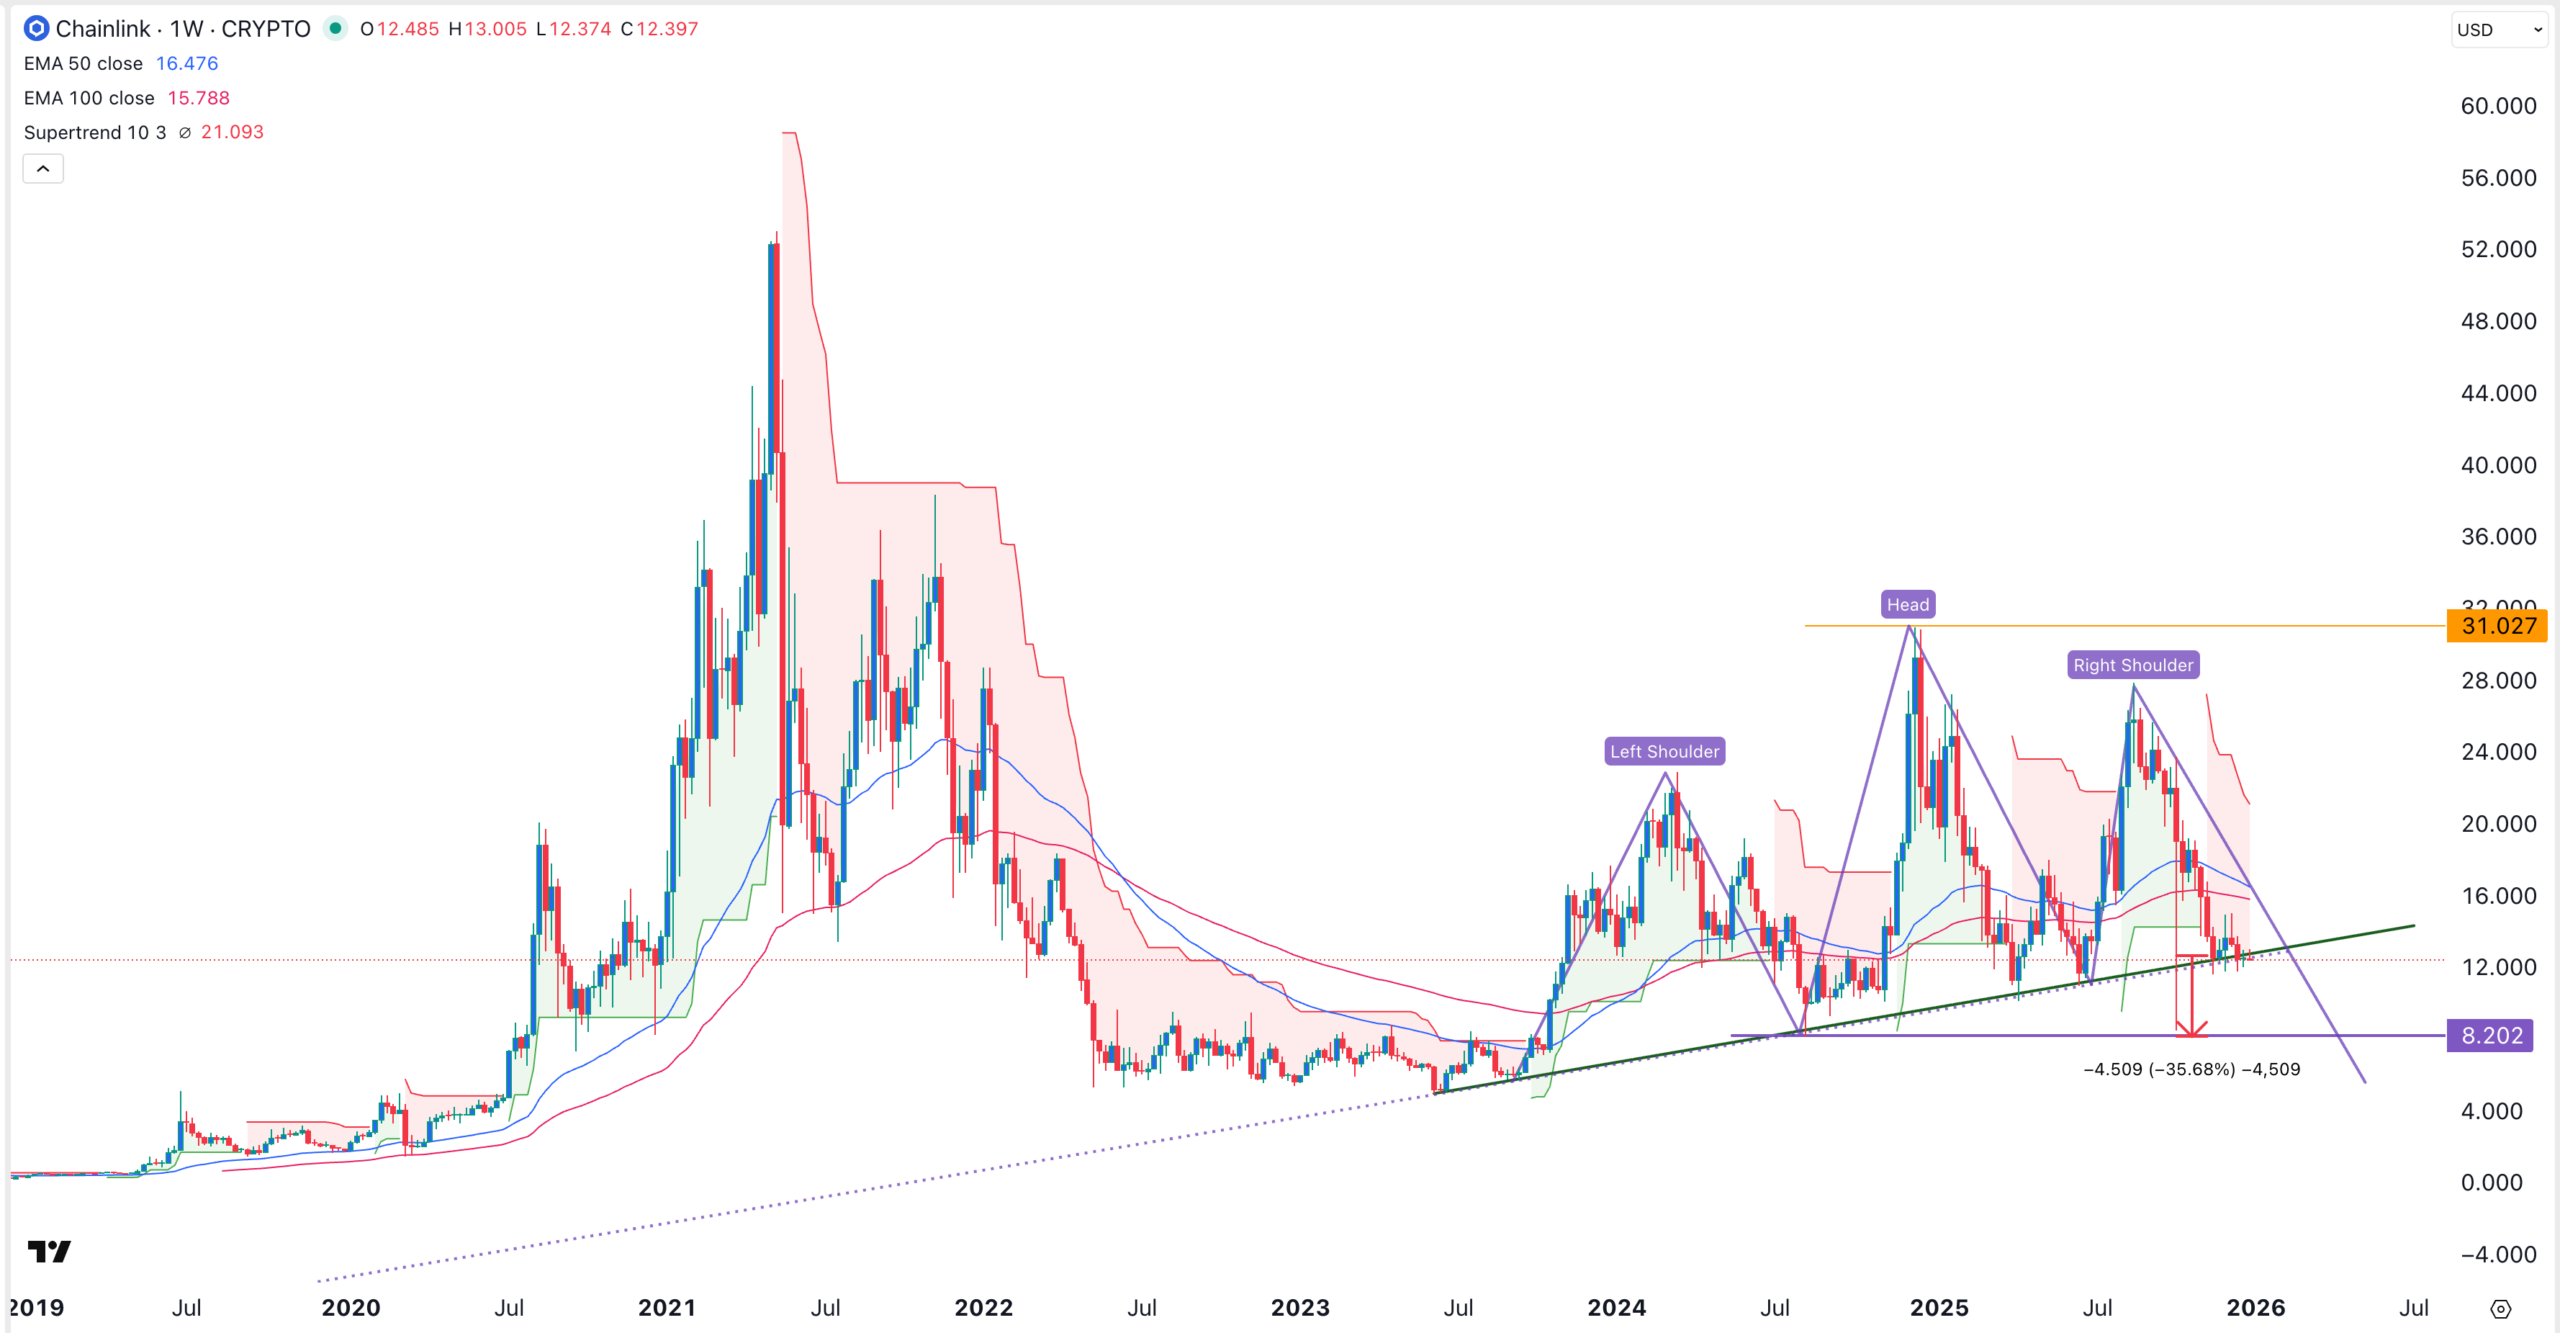
The weekly chart shows that the LINK price has dropped in the past few months as it dropped from a high of $31 in November last year to the current $12.55.
This decline has pushed it below the 50-week and 100-week Exponential Moving Averages (EMA), while the Supertrend indicator has turned red. Most importantly, the token has slowly formed a head-and-shoulders (H&S) pattern.
A H&S pattern is made up of four key parts, including a head, two shoulders, and a neckline. In this case the head is its highest level in November last year, while its left shoulder is its highest point in March last year. It recently formed a right shoulder at $28, and is now in the neckline.
Therefore, the most likely Chainlink price prediction is bearish, a move that will be confirmed if it moves below the neckline. Such a move may see it drop to the key support level at $8.200, the highest in August last year and October 6. This target is about 35% below the current level.
LINK ETF Inflows Have Stalled
One main bearish catalysts for the LINK price is that the Chainlink ETF inflows have largely stalled in the past few days, a sign of weak demand for the coin.
Data compiled by SoSoValue shows that the spot Grayscale LINK ETF has accumulated over $54 million in inflows since the approval earlier this month and now has over $73 million in assets.
Recently, however, the fund has not had any inflows in the last two days. Its weekly inflows last week stood at $2.3 million, its lowest increase ever recorded. It was down by 35% from the previous week’s $3.63 million.
In contrast, the spot XRP and Solana ETFs have accumulated over $1 billion and $700 million in inflows, respectively, a sign that the network is experiencing low demand from investors.
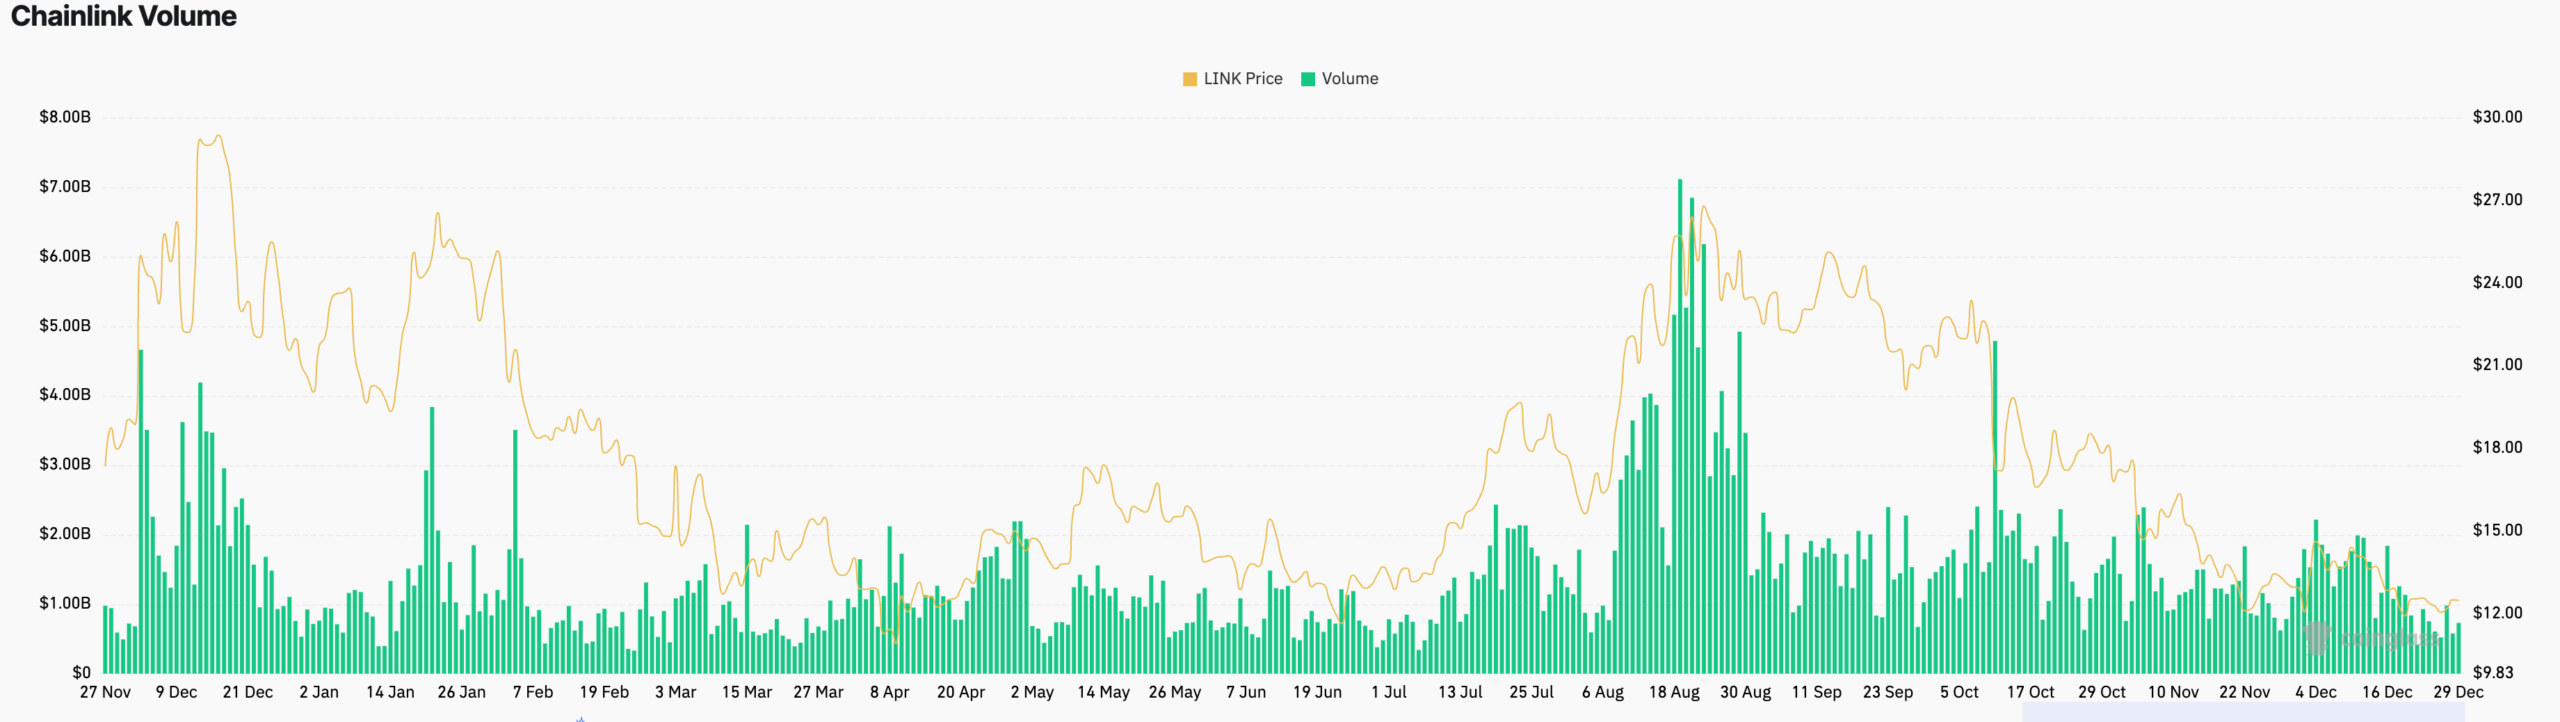
More data shows that demand in the spot market fell steadily in the past few weeks. Data compiled by CoinGlass shows that the daily volume of LINK traded in exchanges has dropped to $728 million, down from the year-to-date high of $7.1 billion. As the chart below shows, the figure has been in a steady downward trend in the past few months.
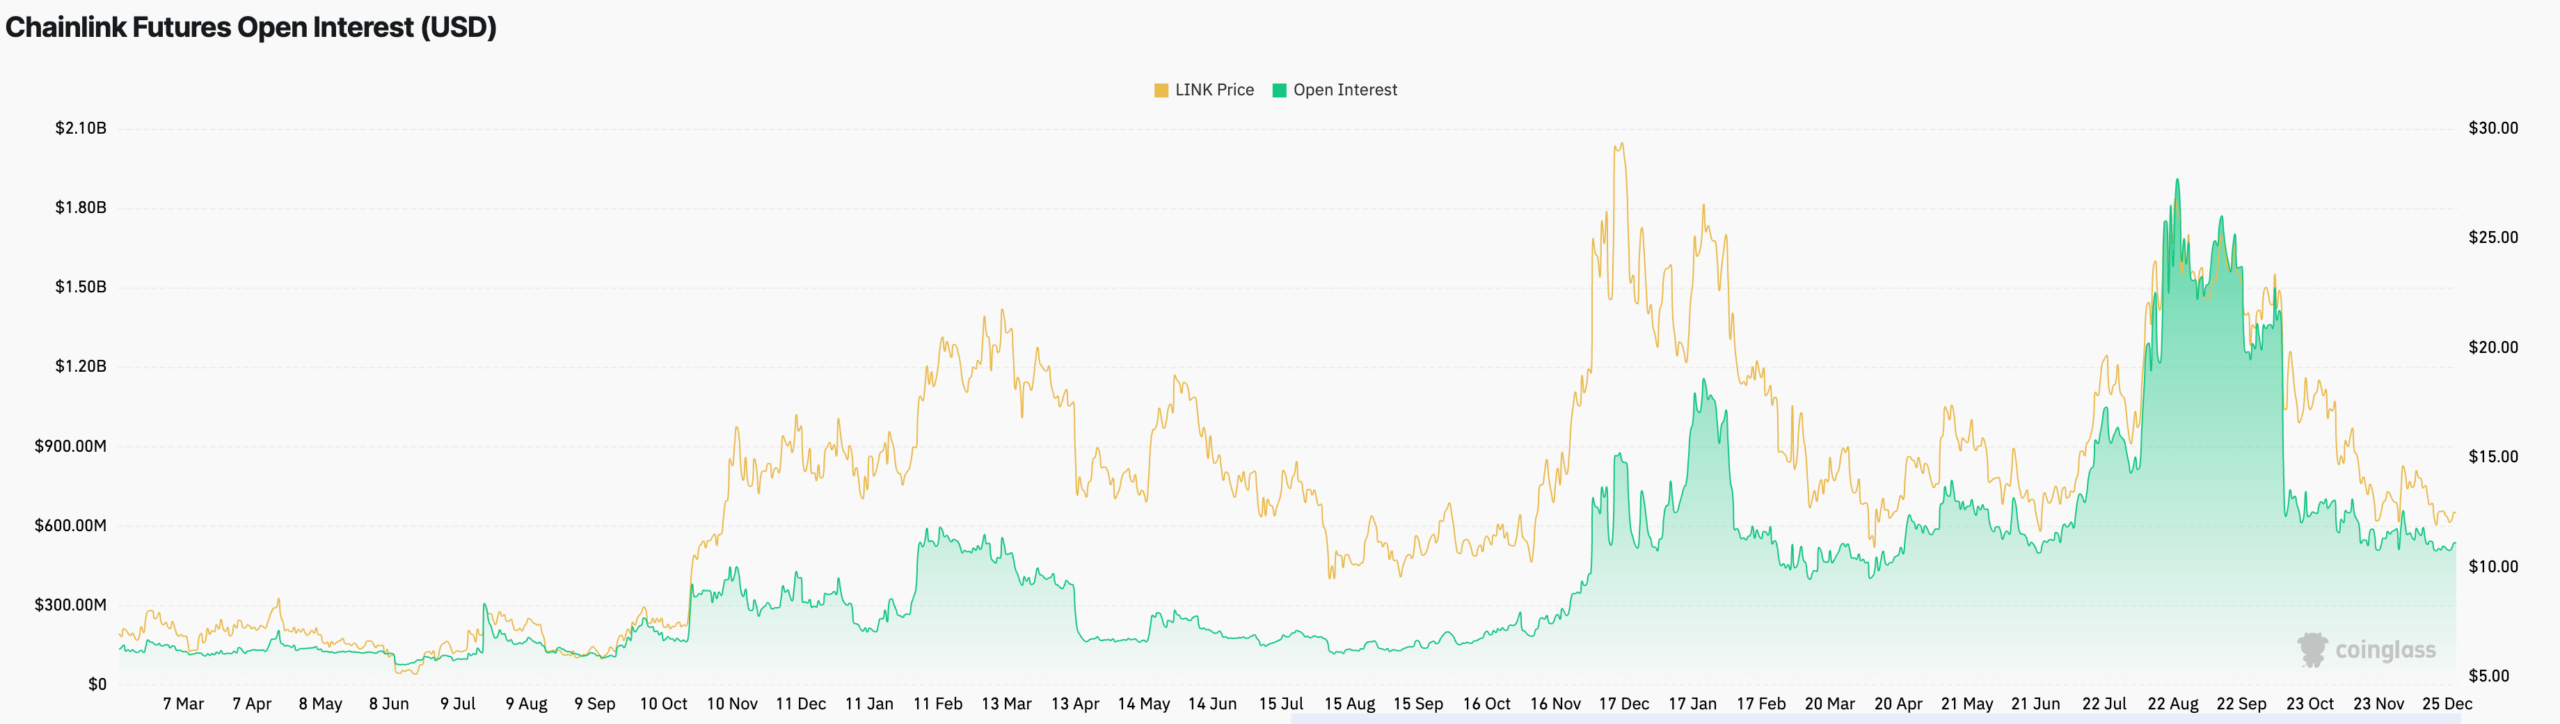
Additionally, the futures open interest has been falling in the past few months, a situation that escalated after the October 10 liquidation event. The open interest dropped to $538 million on Monday, the lowest level since April this year. It has been in a strong downward trend after peaking at $1.84 billion earlier this year.
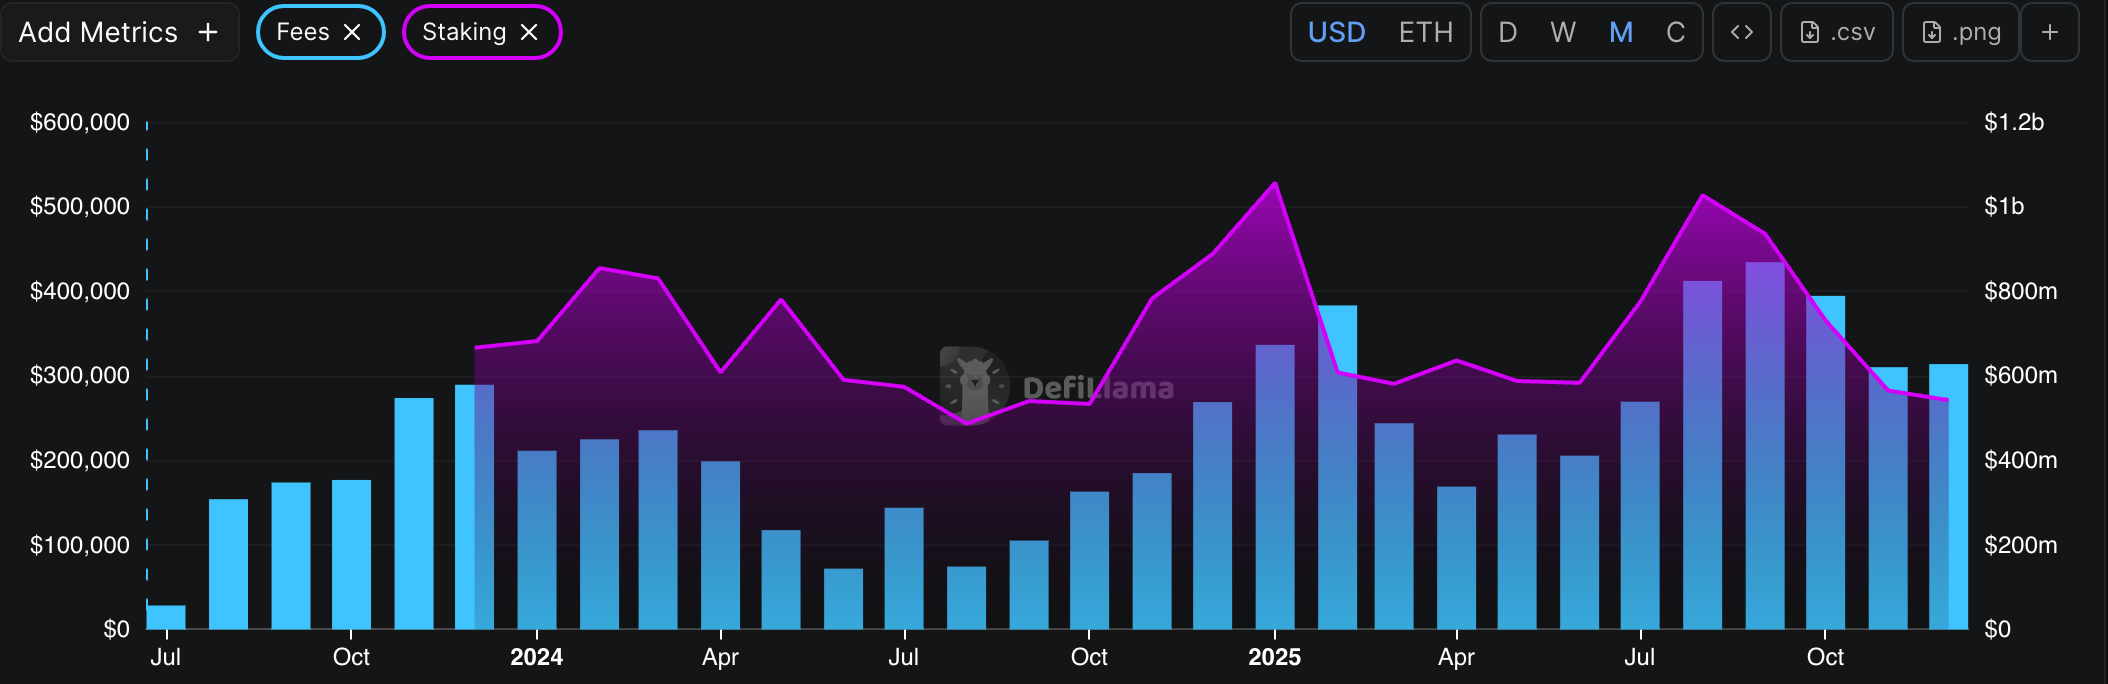
More data also shows that the amount of staked LINK tokens has continued falling, a sign that some long-term investors have started to capitulate. The amount of staked LINK tokens has dropped from $1.02 billion in August to the current $542 million.
Additionally, Chainlink’s fee growth has stalled. The network’s fees dropped to $313,910 from September’s $434,515.
Chainlink is one of the most popular players in the crypto industry, where it offers oracle solutions that power most players in the decentralized finance (DeFi) sector. It has a total value secured (TVS) of over $60 billion, much higher than other networks like RedStone and Chronicle.
Chainlink has also become a major player in the fastest-growing real-world asset tokenization industry, where it is utilized by some of the top financial entities.



