Wisp
Wisp Doge Pepe
 Crawlerpad
 Zylo Ecosystem
 Pearl
Pearl Basic Attention
 Quantus

Dogecoin price is trading near a major compression zone after weeks of narrowing movement. Technical indicators indicate tightness in volatility in several timeframes. Analysts agree that DOGE price is coming to a decisive moment that could define its 2026 path.
Dogecoin Price Prediction: Structure Keeps Upside Target in Focus
Dogecoin price still respects a wider uptrend that began developing in early 2022. Javon Marks pointed out that price has been holding lower lows throughout multi-month cycles. This structure is suggestive of accumulation rather than distribution.
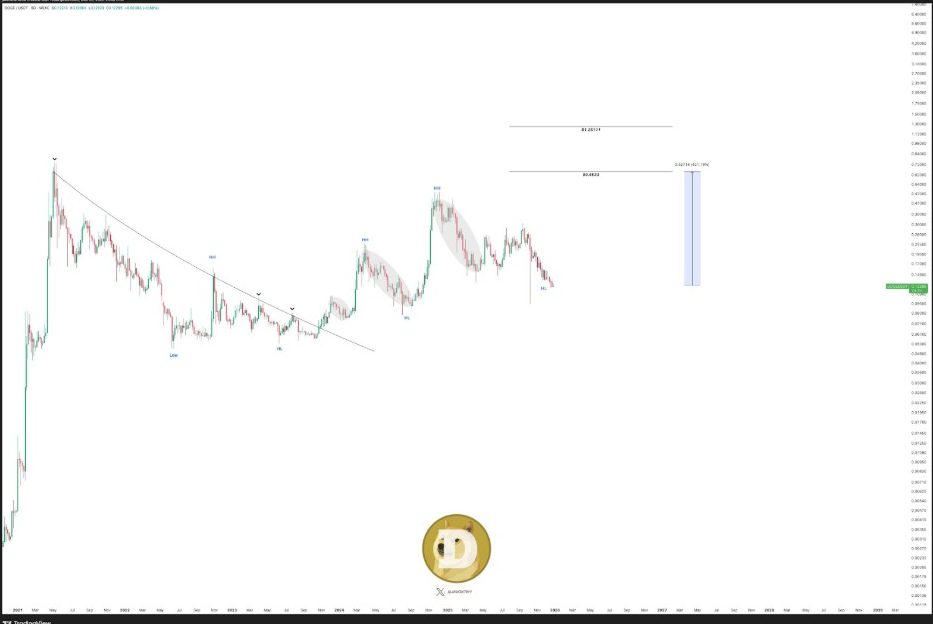
According to his long-term chart, there is a primary breakout target still near $0.6533. That level is more than 400% above current price levels. The projection represents historical areas of expansion and not short-term momentum.
The chart showed the top meme coin forming rounded bases before impulsive moves. Each base was followed by a powerful vertical increase in previous cycles. This trend is consistent with the idea of delayed upside, rather than trend failure.
A confirmed breakout above $0.6533 would expose the $1.25 zone. That level is in line with previous macro extensions on DOGE price charts. However, the move is dependent upon support at higher timeframes.
Descending Triangle Pattern Indicates Volatility Expansion
On the daily timeframe, Dogecoin price created a descending triangle. Trader Tardigrade confirmed the close of the daily candle within this structure. The pattern represents falling volatility and squeezed price action.
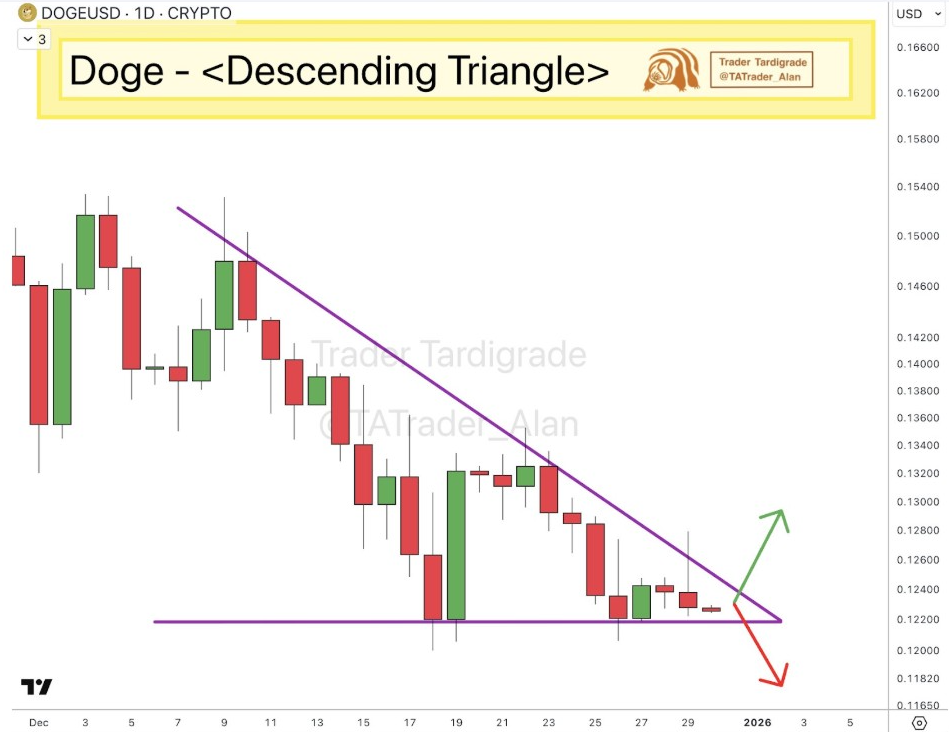
Descending triangles tend to be resolved by sharp expansions. The direction is determined by which boundary breaks first. DOGE is currently trading slightly above horizontal support at around $0.12.
Repeated lower highs indicate selling pressure at resistance. At the same time, buyers do not stop defending the same support zone. This standoff provides a greater likelihood of a decisive move.
A close above descending resistance daily would be a bullish continuation. A breakdown below support would probably set off an accelerated downside. Volume expansion is a prediction when direction confirms.
Mid-Term Targets Cluster Around $0.20 and $0.33 Zones
On the weekly timeframe, DOGE price is seen to have repeated reactions at or close to $0.20. Analysts noted that this resistance level has been tested a number of times. Repeated taps often weaken the sellers over time.
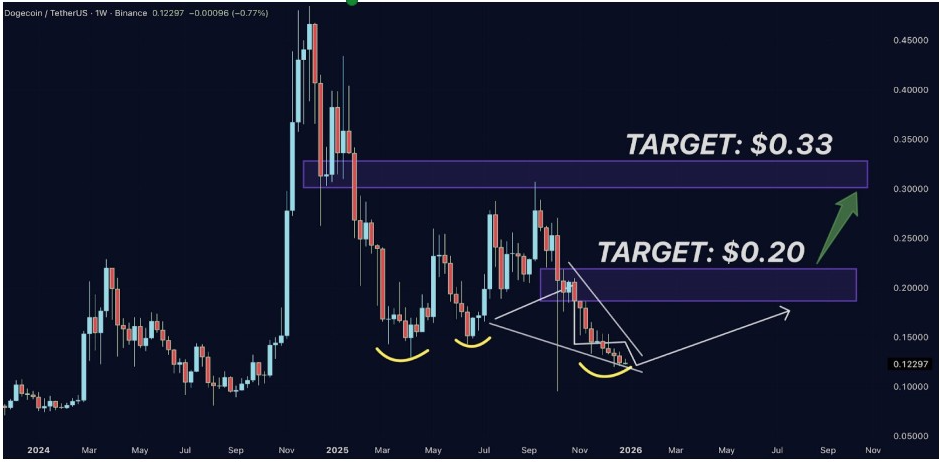
The rounded accumulation formations are shown on the weekly chart. These formations suggest that buyers are active despite pullbacks. This makes the case for gradual recovery as opposed to impulsive spikes.
A confirmed breakout above $0.20 would change the market structure. That move may clear the way to the $0.33 resistance zone. Both levels are on previous consolidation ranges.
The $0.33 zone is also a historical area of supply. Taking it back would be a sign of renewed bullish control. Failure to reclaim keeps DOGE range-bound.
DOGE Price Short-Term Projections
Meanwhile, Crypto GVR offered short-term projections for early 2026. Their estimates put DOGE price close to $0.16 in January. February projections increase to close to $0.20.
As of March 2026, DOGE is expected to be around $0.24. These projections are consistent with the gradual recovery of trends. They do not presuppose immediate breakout conditions.
Current price action is still in the center of $0.12 support. This level has been addressed many times in previous corrections. Sustained closes below it would undermine the bullish structure.
Volume is muted during consolidation. Low-volume conditions are often a precursor to volume expansion. Traders are now looking for confirmation instead of anticipation.
DOGE price is still technically neutral between support and resistance. The next breakout or breakdown confirmed will be the definition of momentum.