
 Pearl
Pearl NEAR Protocol
 Bitway
 Starknet
 Walrus
 Pudgy Penguins
 Hyperliquid

HBAR price retreated for three consecutive days, reaching a low of $0.1200, down slightly from this week’s high of $0.1337. It has crashed by 60% from its highest level in July last year and by 70% from its highest point in January. This retreat could continue in the coming weeks as key metrics in the network continue falling.
HBAR Price Technical Analysis
The daily timeframe chart shows that the Hedera price has been in a strong downward trend in the past few months. It plunged from a high of $0.3053 in July to the current $0.1200.
The token has moved below the important support level at $0.1247, its lowest level in April and June last year. This was an important level; failing to move below it is a sign that bears have prevailed.
Most notably, the token has retested that level, confirming the popular break and retest pattern, which leads to the continuation of a bearish breakout.
The token remains below the 50-day and 100-day Exponential Moving Averages (EMA) and the Supertrend indicator. At the same time, the token has formed a descending channel, while the Relative Strength Index (RSI) and the MACD indicators have continued moving downwards.
Therefore, the coin will likely continue falling in the near term as traders target the next key support level at $0.1035, its lowest level in December.
A move below that level will point to more downside, potentially to the key support at $0.08518. It was its lowest level in October when cryptocurrencies plunged, leading to a wave of liquidations. This target is about 30% below the current level.
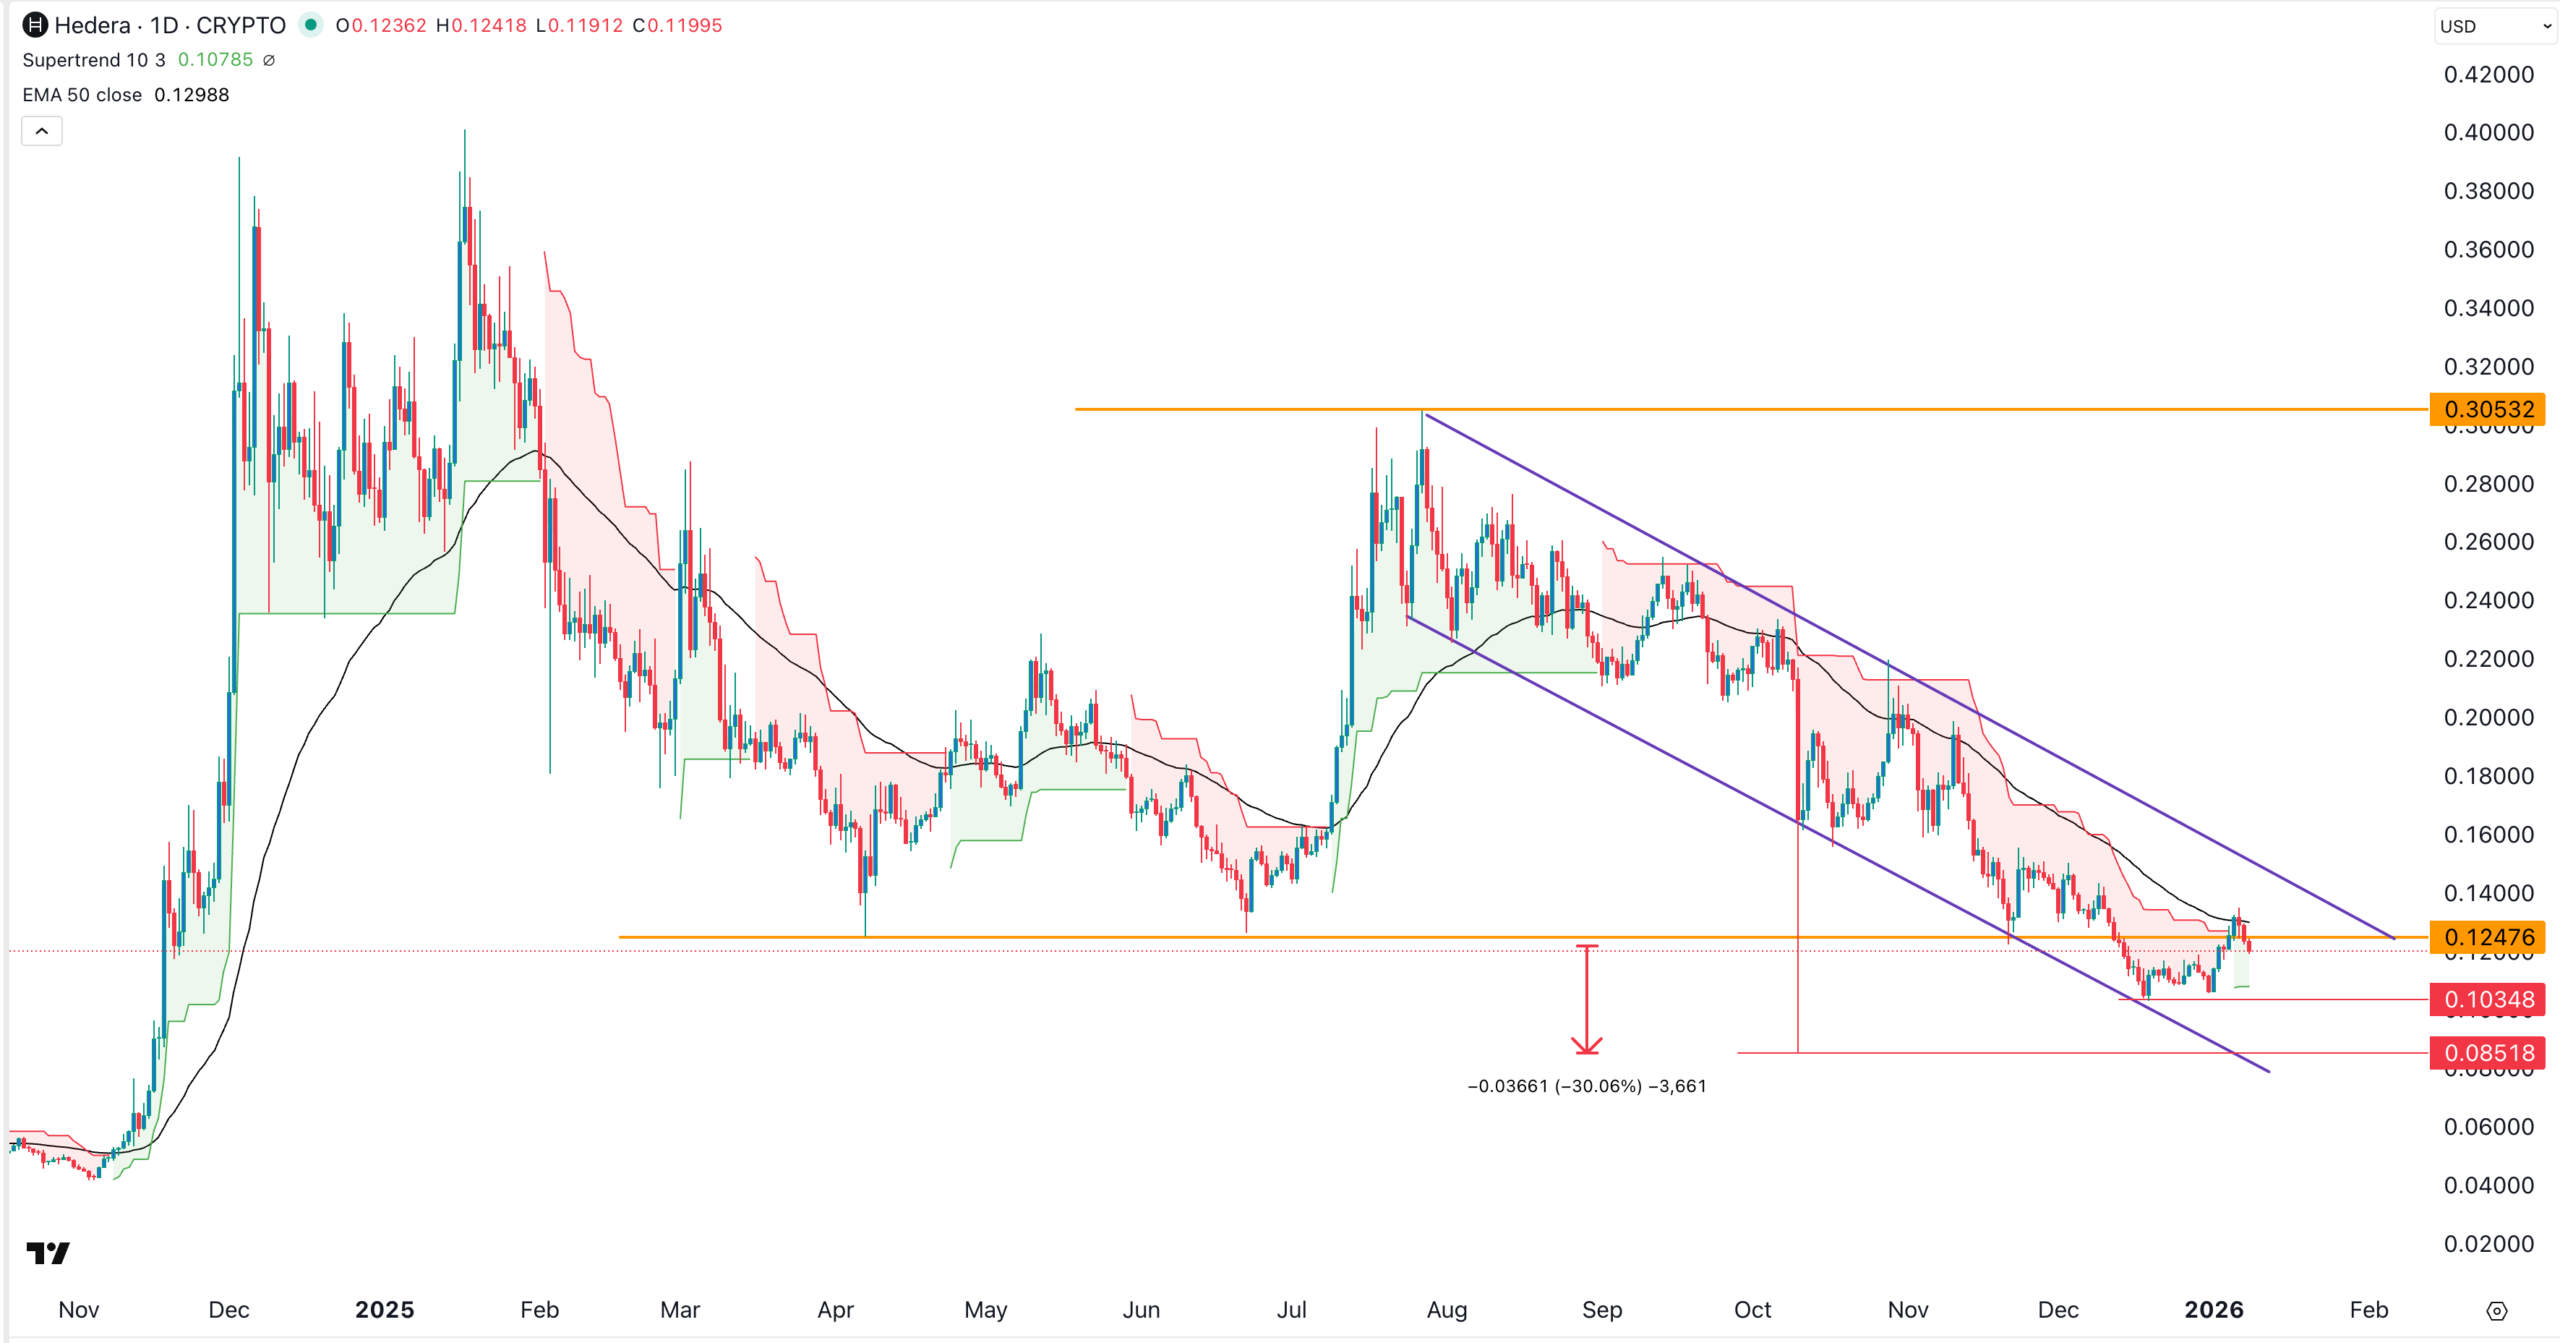
The bearish HBAR price prediction will be invalidated if it moves above the important resistance level at $0.15. Such a move will lead to more gains over time.
Hedera Hashgraph’s DeFi Total Value Locked Has Plunged
HBAR price has dropped in the past few months, and this trend could continue in the coming weeks as its ecosystem growth deteriorates. There are signs that Hedera Hashgraph has not yet achieved its goal of disrupting Ethereum, despite offering faster speeds and lower transaction costs.
Data compiled by DeFi Llama shows that the network’s total value locked (TVL) has dropped to over $127.6 million. The TVL is down from its high of nearly $400 million last year. It has remained unchanged at 1.05 billion in HBAR terms, down from 1.50 billion on October 28, 2024.
Other DeFi metrics have continued to fall over the past few months. For example, the DEX volume stood at over $10.2 million in the last 24 hours. In contrast, other chains, such as Base, Arbitrum, Ethereum, and Solana, handled billions of dollars during the same period.
Hedera has also positioned itself as a major player in the stablecoin industry, which is set to benefit from the GENIUS Act. Data shows that its stablecoin volume is a tiny amount. Its stablecoin supply stands at $124 million, also a tiny amount in an industry with over $307 billion in assets.
HBAR ETF Inflows Have Dried Up Recently
Meanwhile, the recently launched Canary HBAR ETF (HBR) has had no inflows for a while. Data compiled by SoSoValue shows that the last HBAR ETF was at $898k on December 24th. Since then, the fund has not had any inflows.
Hedera’s ETF has had cumulative net inflows of $83 million. That’s much lower than other popular funds of tokens like Solana and XRP. The total net assets stand at $58 million, which is equivalent to 1.10% of the market capitalization.
The XRP ETFs have had over $1.2 billion in inflows, while Solana funds have had $803 million in inflows. These numbers indicate that HBAR has not experienced strong demand from American investors.
In summary, HBAR price faces major technical and fundamental risks ahead. It remains below all moving averages and the Supertrend indicator, pointing to more downside over time.




