
 Zylo Ecosystem
 astronaut
 Pearl
Pearl Walrus
 Starknet
 Pudgy Penguins
 Bitcoin

Dogecoin price is gaining fresh momentum. Analysts highlight market cycles, pointing to a possible third bull wave. They see signs of another major rally ahead.
Trading around $0.125, the DOGE price is still in a consolidation range. However, numerous technical charts indicate an explosive breakout could be coming.
Memecoins are coming to the forefront again. Analysts compare Dogecoin’s current structure to past bull runs. DOGE is gaining momentum after long accumulation phases. The price shows signs of another rally.
Dogecoin Price Forms Third Wave Structure
Crypto analyst Trader Tardigrade noted that Dogecoin’s long-term weekly chart shows early signs of a “third wave.” He suggested this pattern could mark the start of a major bullish phase.
In past cycles, DOGE has followed the same pattern: accumulation, breakout, and parabolic rise. These took place in 2017 as well as 2021, and both brought huge upside moves.
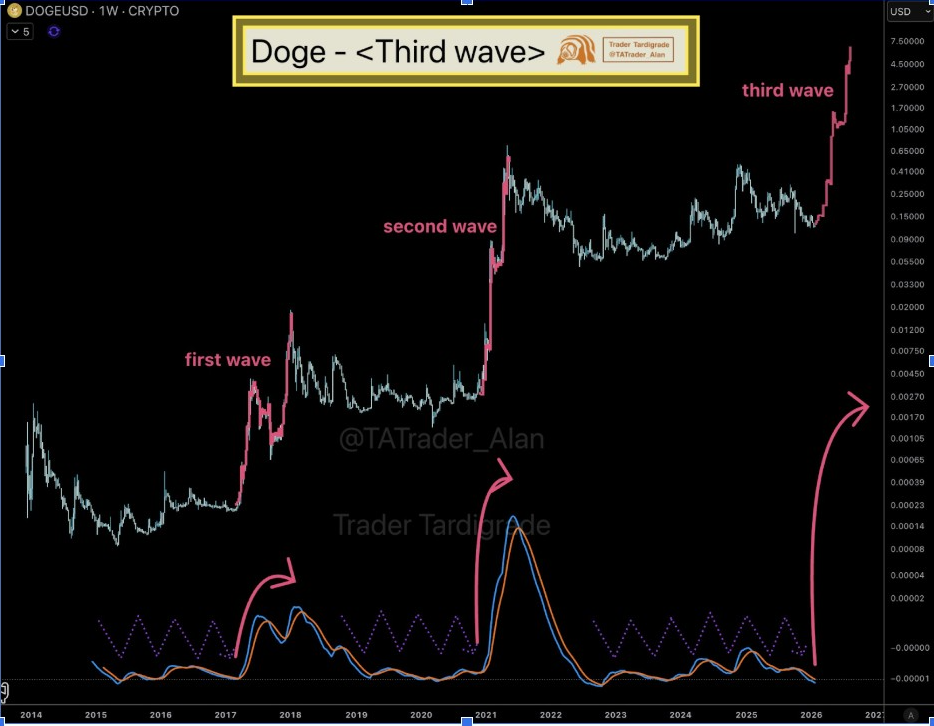
Tardigrade’s current analysis showed striking similarities between today’s setup and those previous waves. Indicators like the MACD are coiling at the base as they did before the last two surges.
His chart showed that price action has entered a similar technical posture. This suggests a major move could be imminent.
The “third wave” structure means that Dogecoin could be on the verge of replicating its past explosive performance.
If the pattern holds, the DOGE price could be preparing for a multi-phase rally. Technical momentum and market sentiment may fuel the move.
Bullish Breakout Pattern Identified on Lower Timeframes
In a short-term analysis, Trader Tardigrade has also identified a busted descending triangle pattern. This is often considered a very strong signal for a bullish reversal.
In this setup, the Dogecoin price broke out above the descending resistance line. This invalidates the previous bearish outlook.
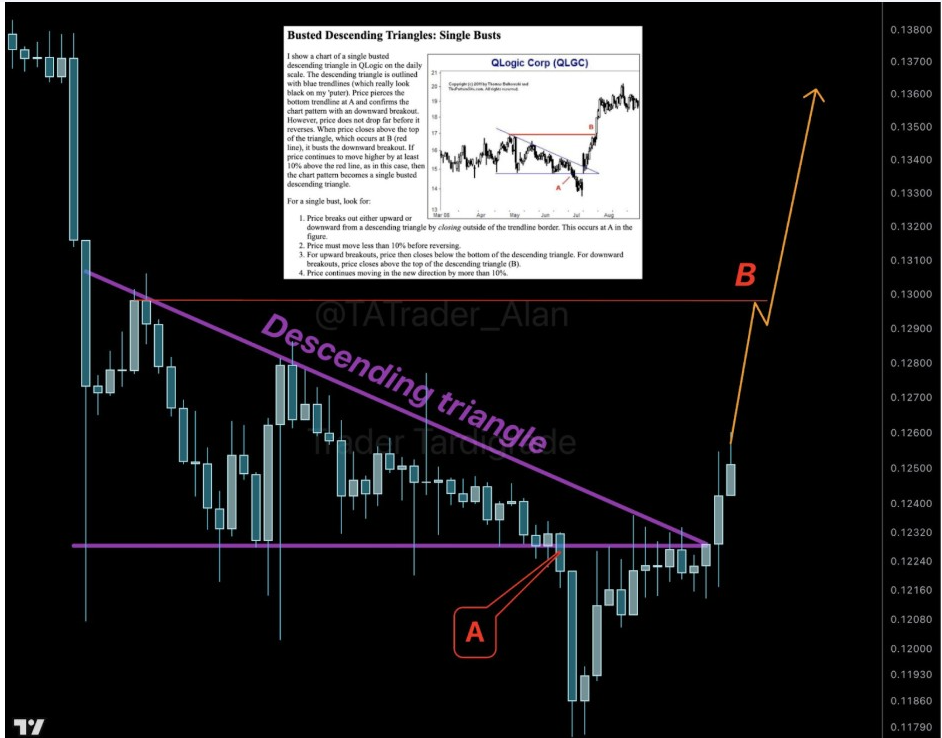
This breakout is now targeting point B, which is at around $0.13. Usually, busted patterns such as this lead to a follow-through upside of 10% or more. The breakout strengthens the larger bullish thesis and lends support for a near-term rally.
DOGE’s ability to hold above this pattern and reclaim higher resistance zones will be key to confirming the bullish reversal. For now, the structure is favorable to buyers.
Analysts See Accumulation Phase Setting Up Next Move for Dogecoin Price
Furthermore, BitGuru added another context with a chart showing Dogecoin in a tight consolidation phase after a recent liquidity sweep.
Stops are flushed out during the price action. The asset compresses inside a demand zone. This setup often triggers a strong continuation rally.
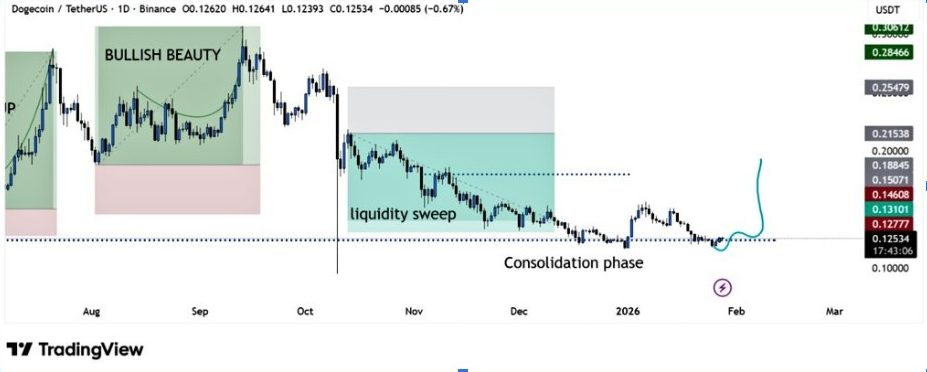
BitGuru’s analysis shows that the DOGE price is trading in a historical demand zone. The price setup points to an expansion move. DOGE may be preparing for a strong rally. This kind of base-building is often observed at the beginning of impulsive legs-up in trending markets.
Analyst Chad shared a long-term “rounded bottom” formation on Dogecoin’s multi-year chart. He noted that this pattern supports the bullish outlook for Dogecoin price. He said that similar basing patterns preceded each of the last two major breakouts.
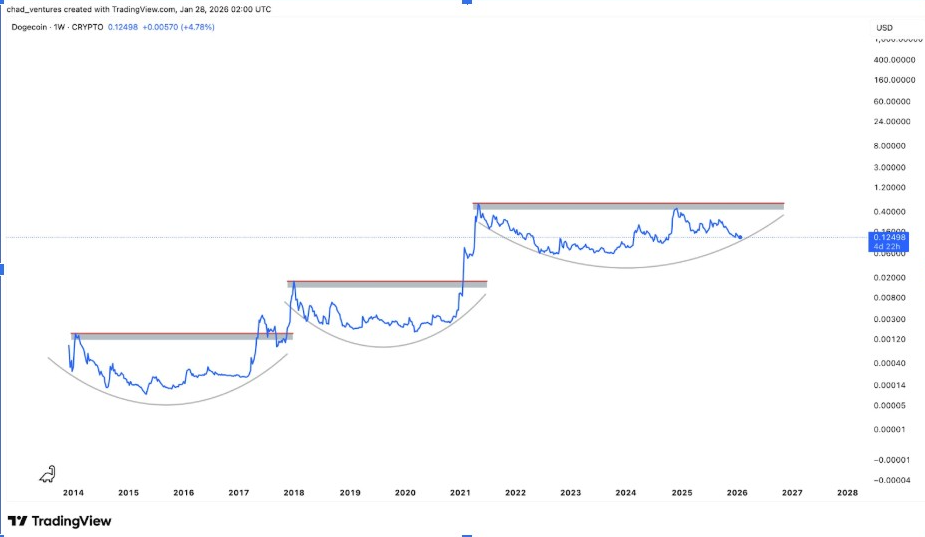
The current accumulation is taking longer. However, it is structurally intact, suggesting a breakout could be forming under the surface.
Historical Cycles Indicate $1 or More
Another major analyst group, Bitcoinsensus, drew attention to the current third big Dogecoin cycle since 2014. Cycle 1 delivered a 5,858% gain. Cycle 2 produced an even larger 21,457% surge. Analysts use this comparison to highlight Dogecoin’s explosive past rallies.
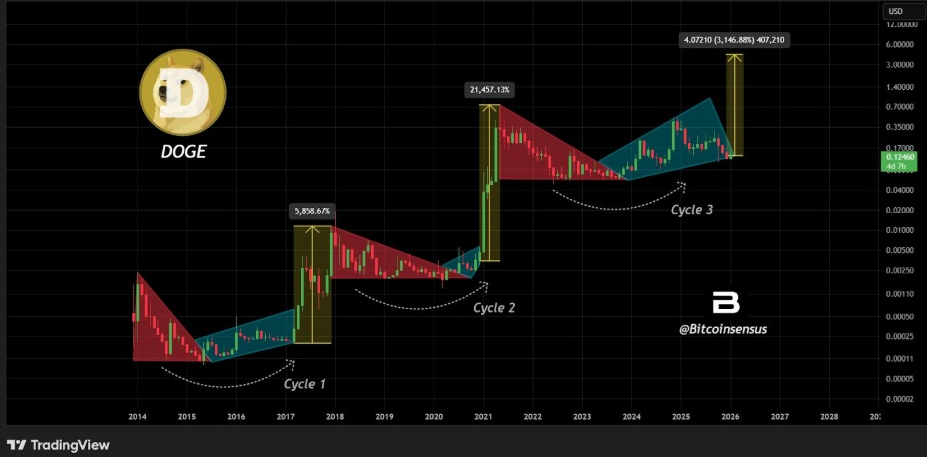
In their latest chart, Cycle 3 is in the middle of accumulation and breakout. It formed a triangular structure much like the previous cycles. If the pattern holds, DOGE could surge again.
While purely speculative, their chart also plots a possible move to $4.07, which would be a 3,000% gain. Many traders are watching the $1 mark as the next resistance. They see it as realistic if market sentiment turns bullish. A stronger crypto mood could push the price of Dogecoin toward that level.



