
 Pearl
Pearl Walrus
 Bitway
 Bitcoin
 Quantus
 Quant
Quant Pudgy Penguins

Solana price remained under pressure on Monday as the crypto market crash intensified, with the market capitalization of all tokens falling to $2.6 trillion, down from an all-time high of $4.2 trillion. Still, the coin has formed a multi-year head-and-shoulders pattern, suggesting more downside in the coming weeks despite soaring network metrics.
Solana Price Prediction: Head and Shoulders Points to a Crash
The weekly chart shows that Solana price peaked at $299 in 2025 and then plunged to a low of $100 on Monday.
A closer look at this chart shows the coin has formed several bearish patterns, suggesting further downside in the near term.
The most important one is the head-and-shoulders pattern, which has been forming since December 2023. It moved to the left shoulder at $205, and the head is at $299. The right shoulder was at $250, and the coin is now at $100. A H&S pattern is one of the riskiest patterns in technical analysis.
Solana price has moved below the 61.8% Fibonacci Retracement level at $118. Also, the coin is about to form a mini death cross pattern, which happens when the 50-day and 100-day Exponential Moving Averages (EMA) cross each other.
The coin has moved below the Supertrend indicator, while the Relative Strength Index (RSI) and the MACD indicators have continued falling.
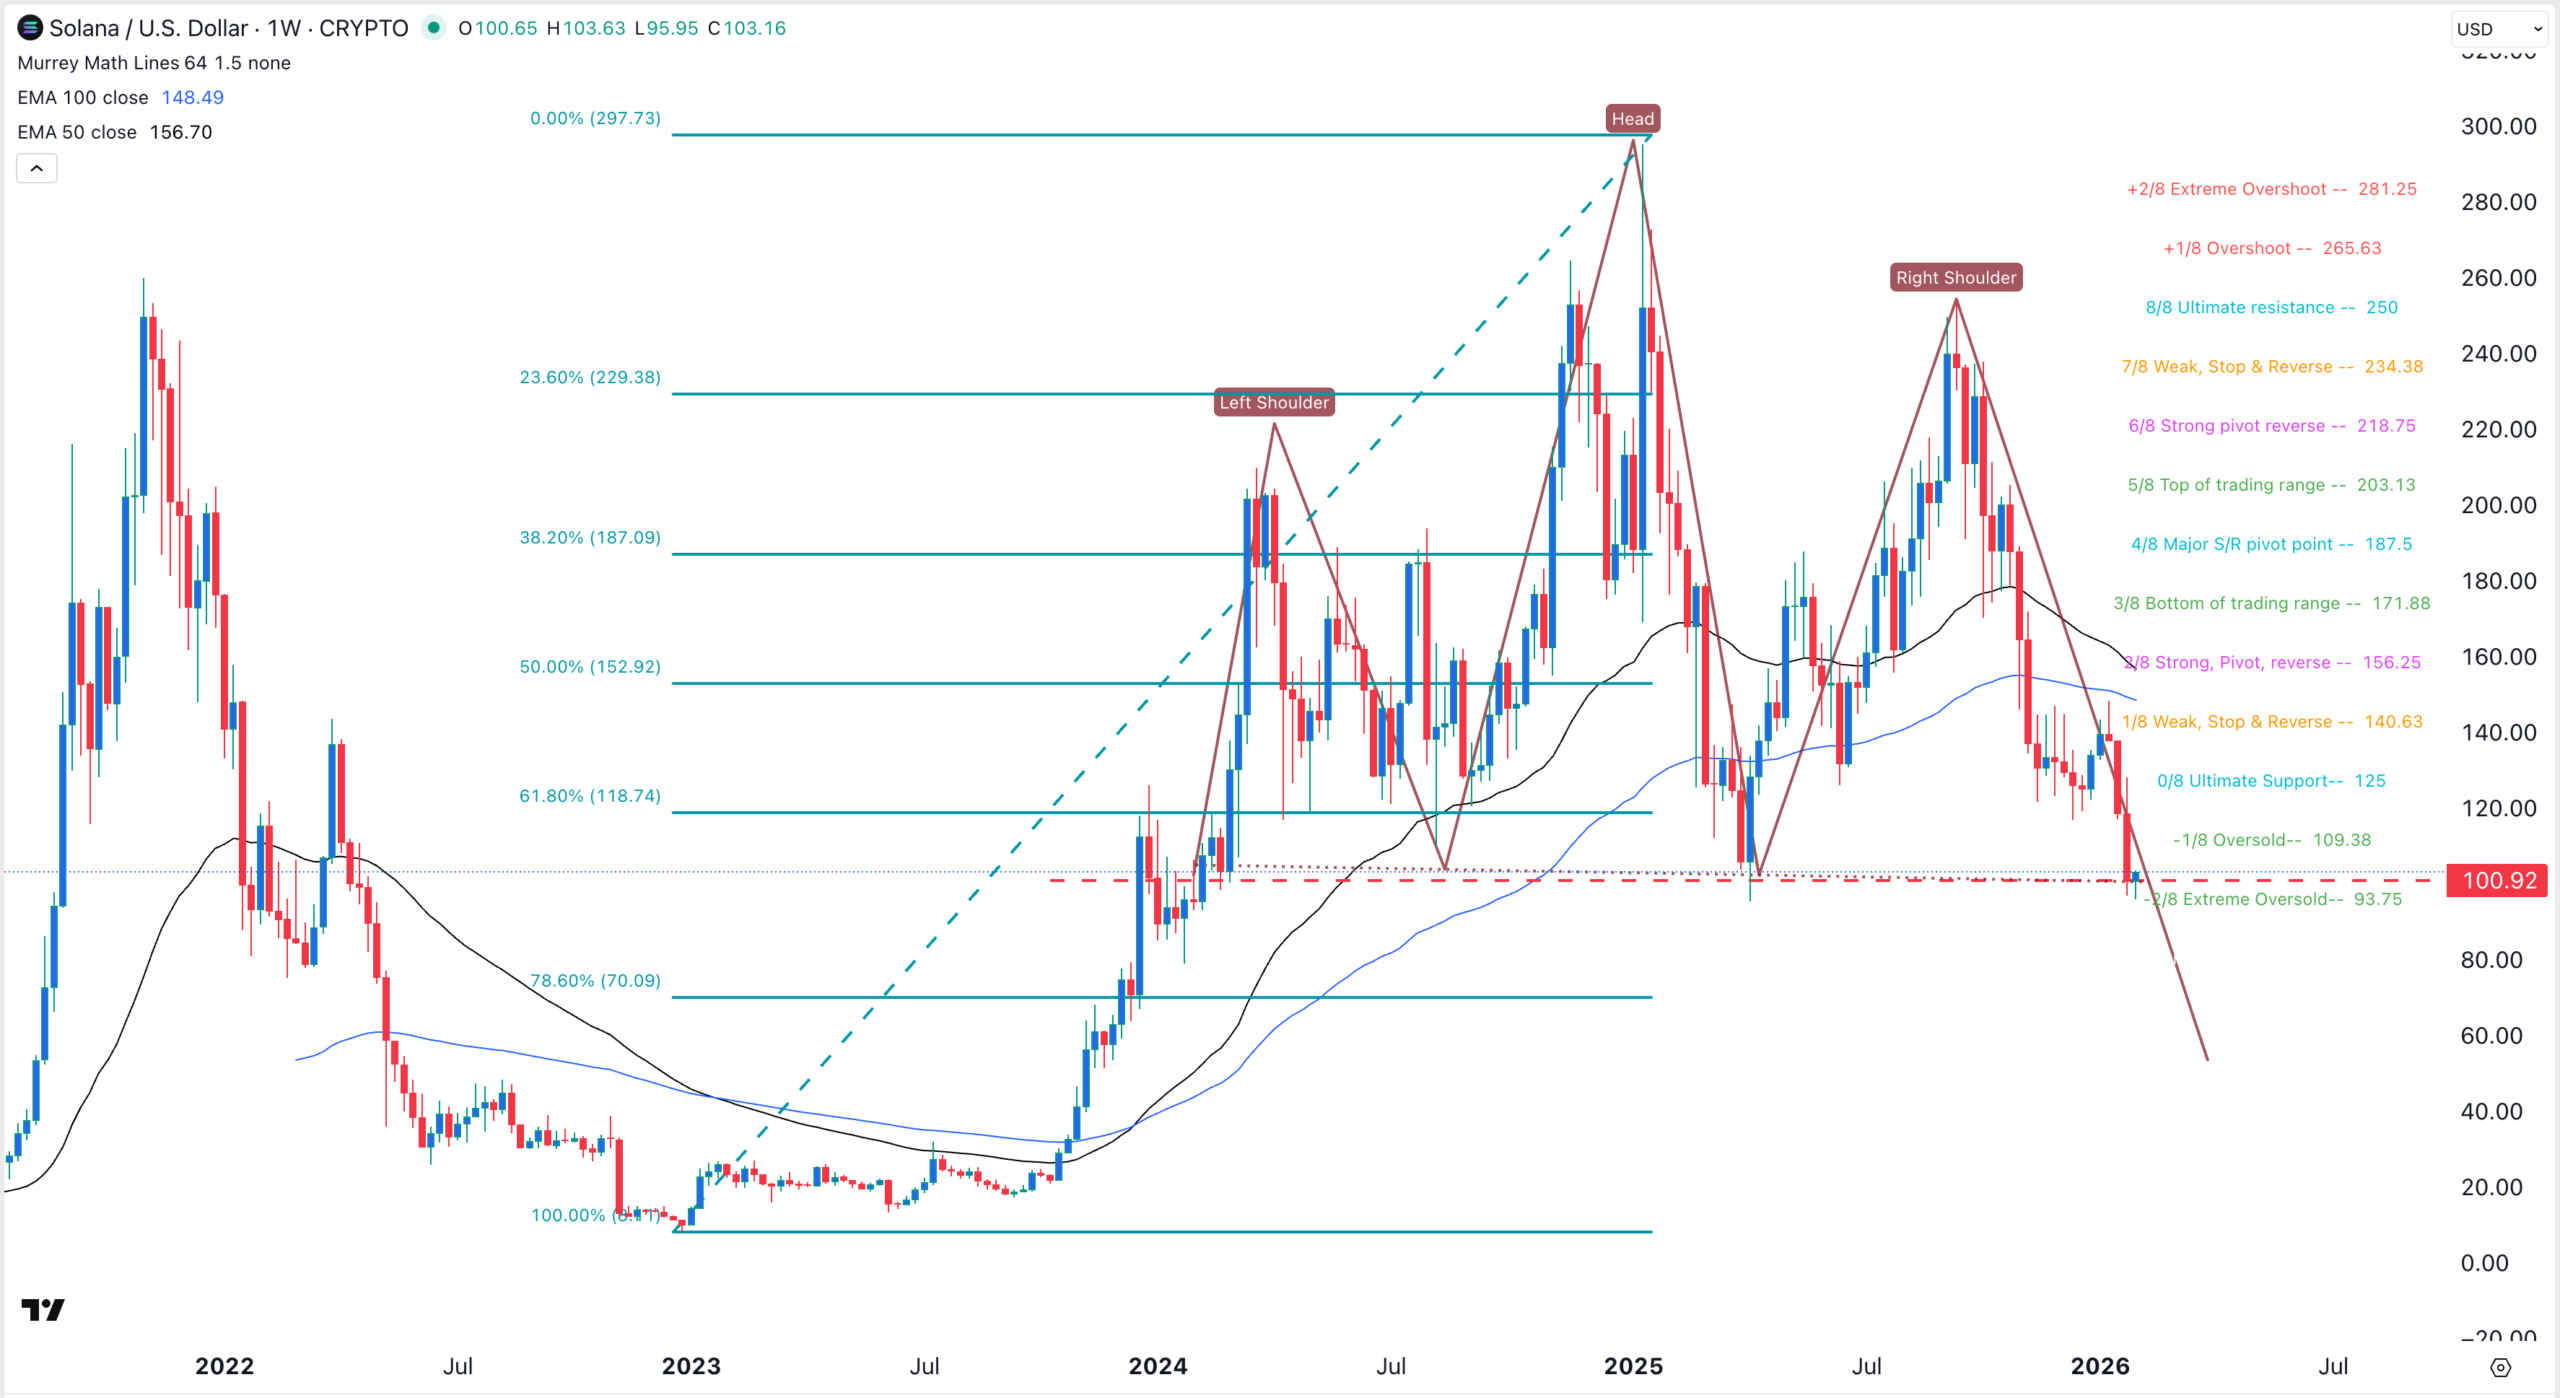
Therefore, the most likely scenario is that the coin continues to fall as sellers target the 78.6% Fibonacci Retracement level at $70. A drop below that level will point to more downside, potentially to the key support level at $50.
SOL Futures Open Interest Continues Falling
The main reason why Solana price may continue falling is the ongoing crypto market crash, which has affected top coins like Ethereum and Bitcoin.
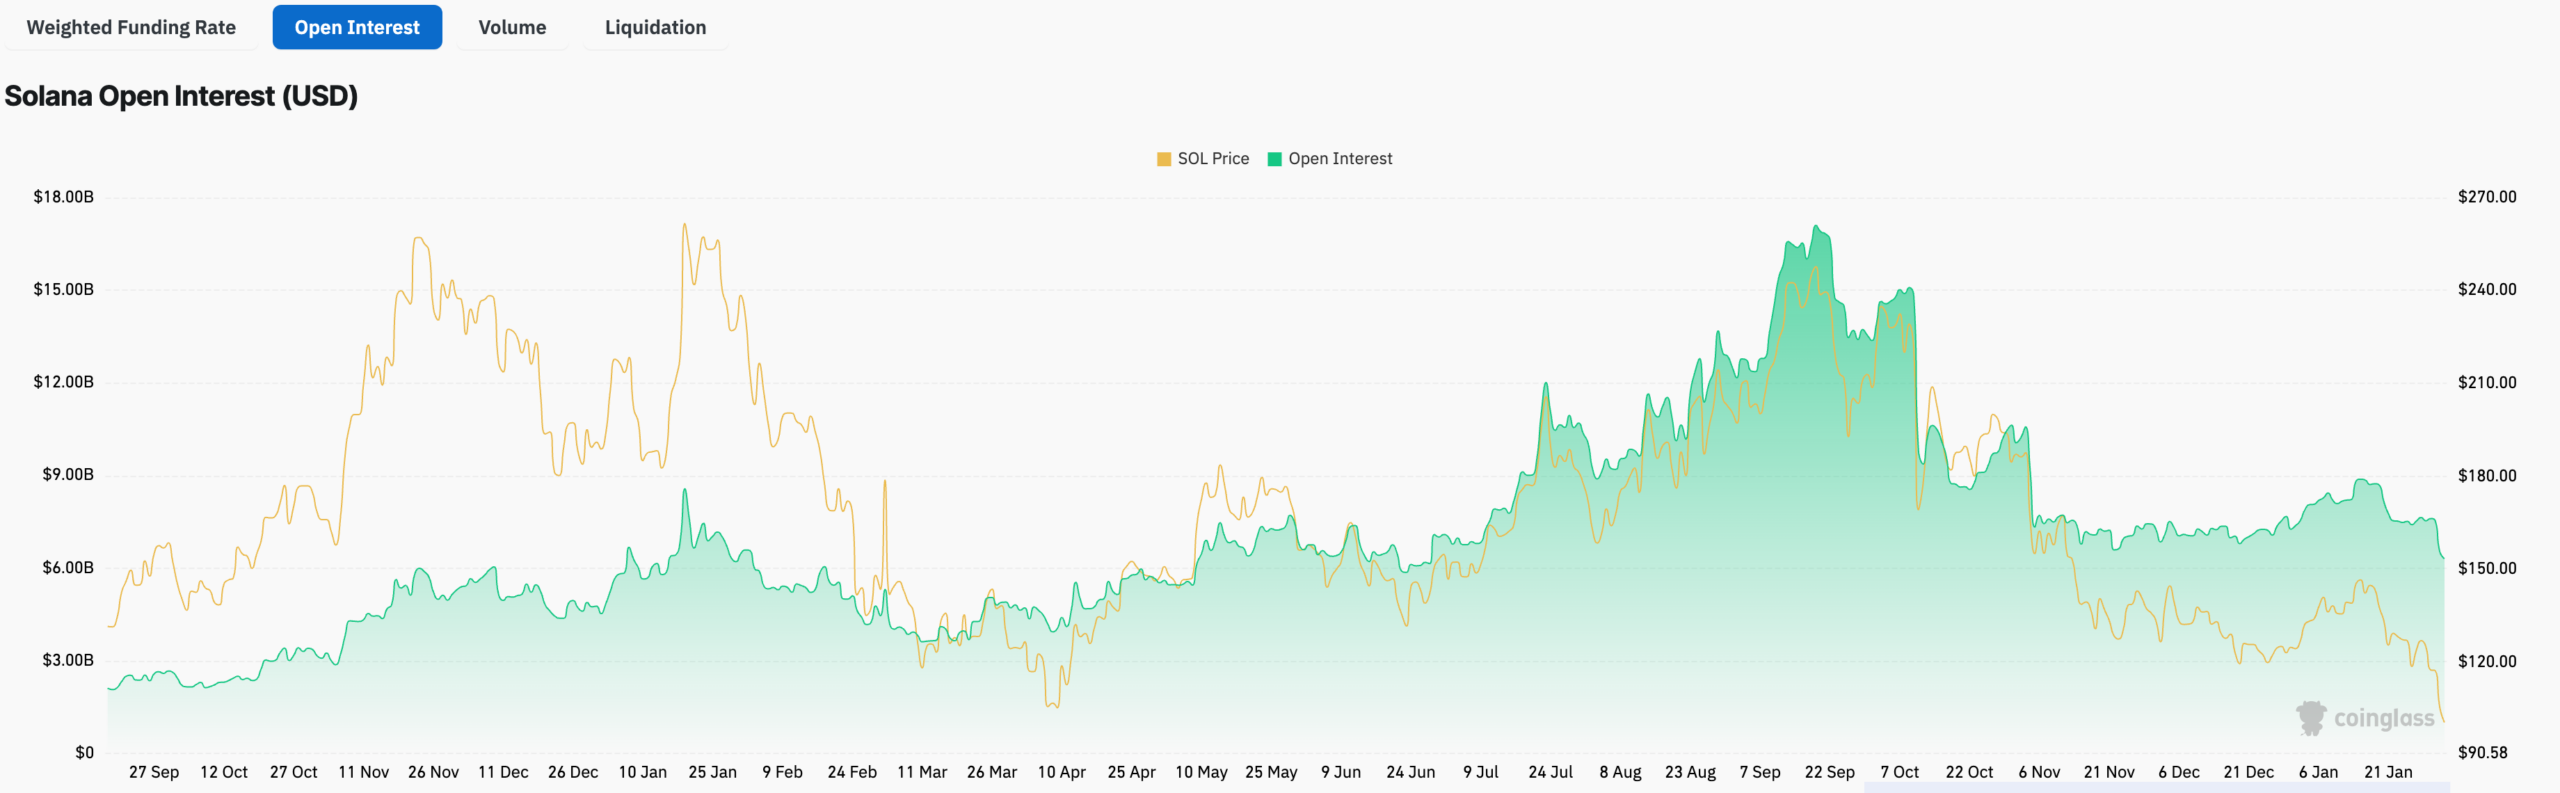
Data compiled by CoinGlass shows that the futures open interest has continued falling in the past few months. The interest dropped to $6.35 billion from over $8.82 billion in January. It has been in a strong downward trend since September last year when it peaked at $17 billion.
Falling open interest is a sign that investors are no longer using as much leverage as they used a few months ago.
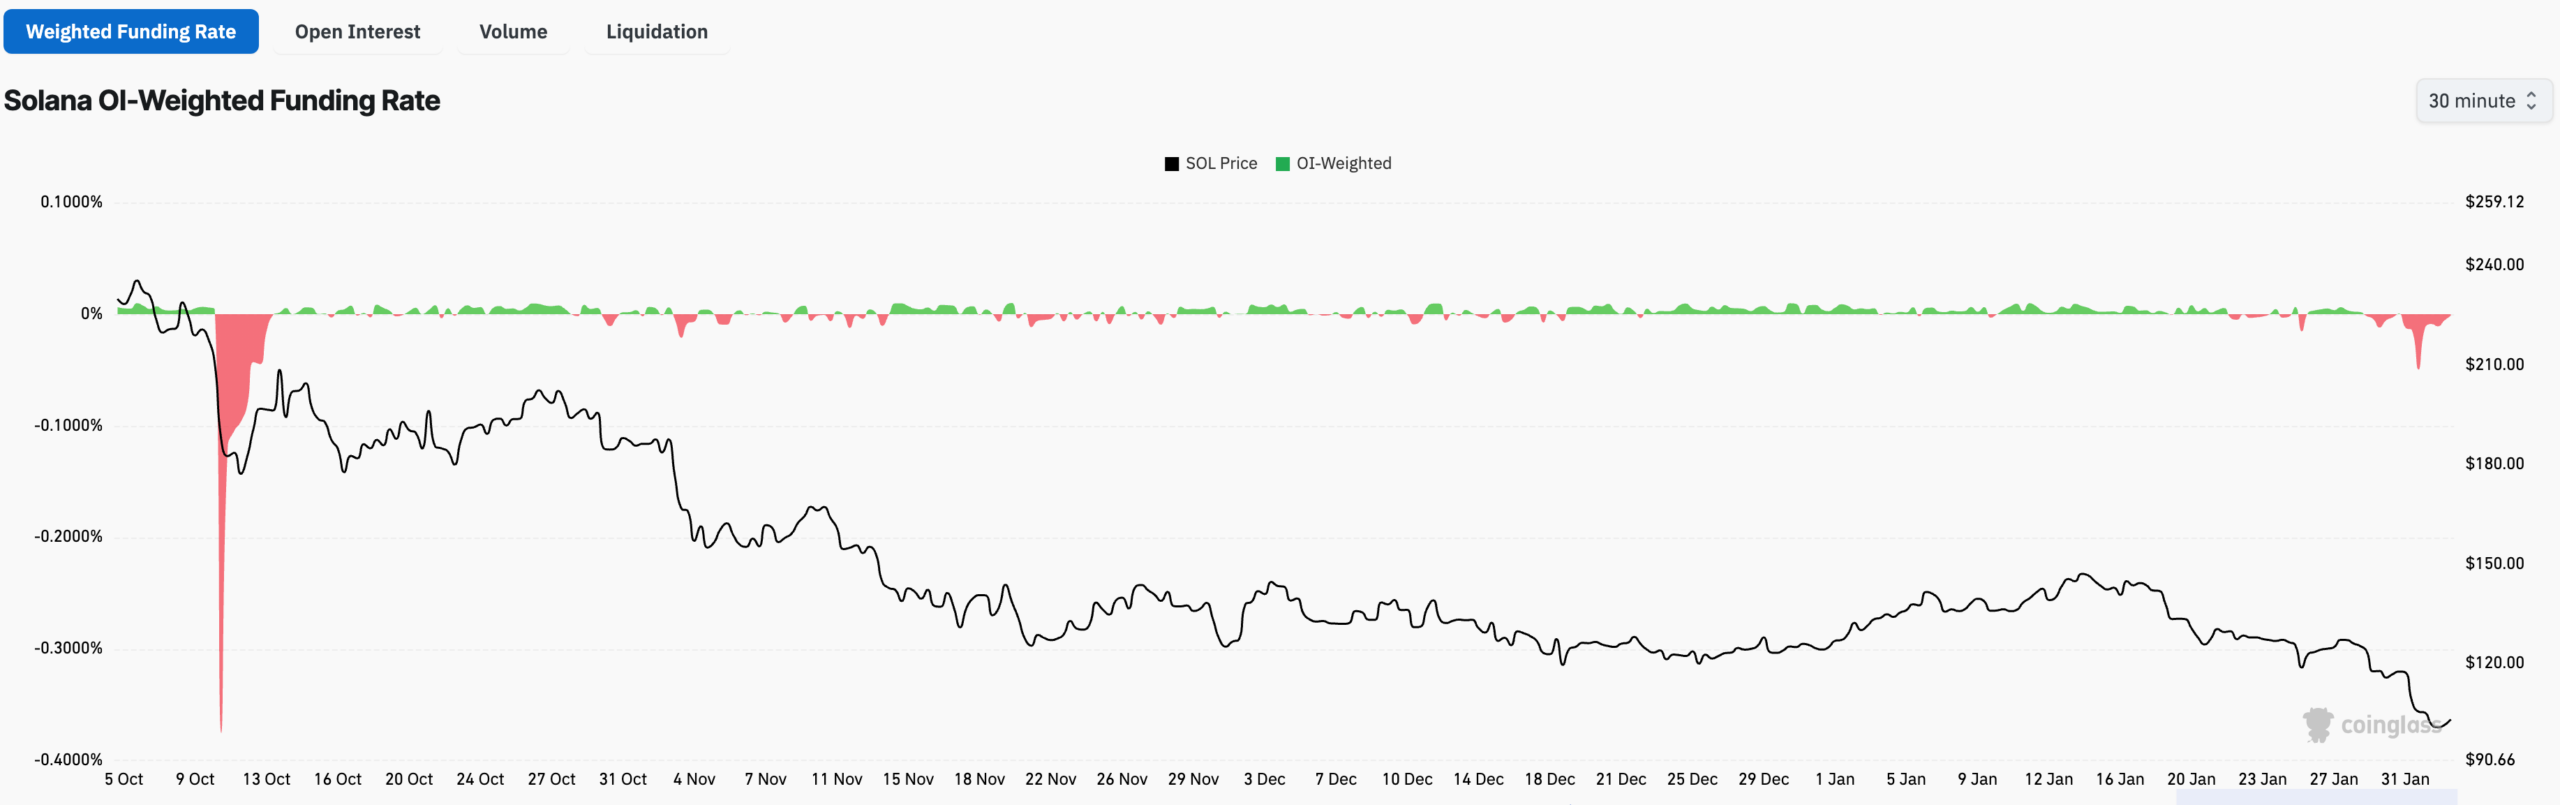
Meanwhile, data compiled by CoinGlass shows that the weighted funding rate has remained in the red in the past few weeks. The funding rate is an important data that looks at the amount of money the bulls and bears have to hold their positions. A negative funding rate is a sign that traders anticipate that the future Solana price will be lower than where it is today.
More data shows Solana’s liquidations continued rising this month. Over $191 million positions were liquidated on February 1, much higher than $37 million a day earlier.
Solana Network is Firing on All Cylinders
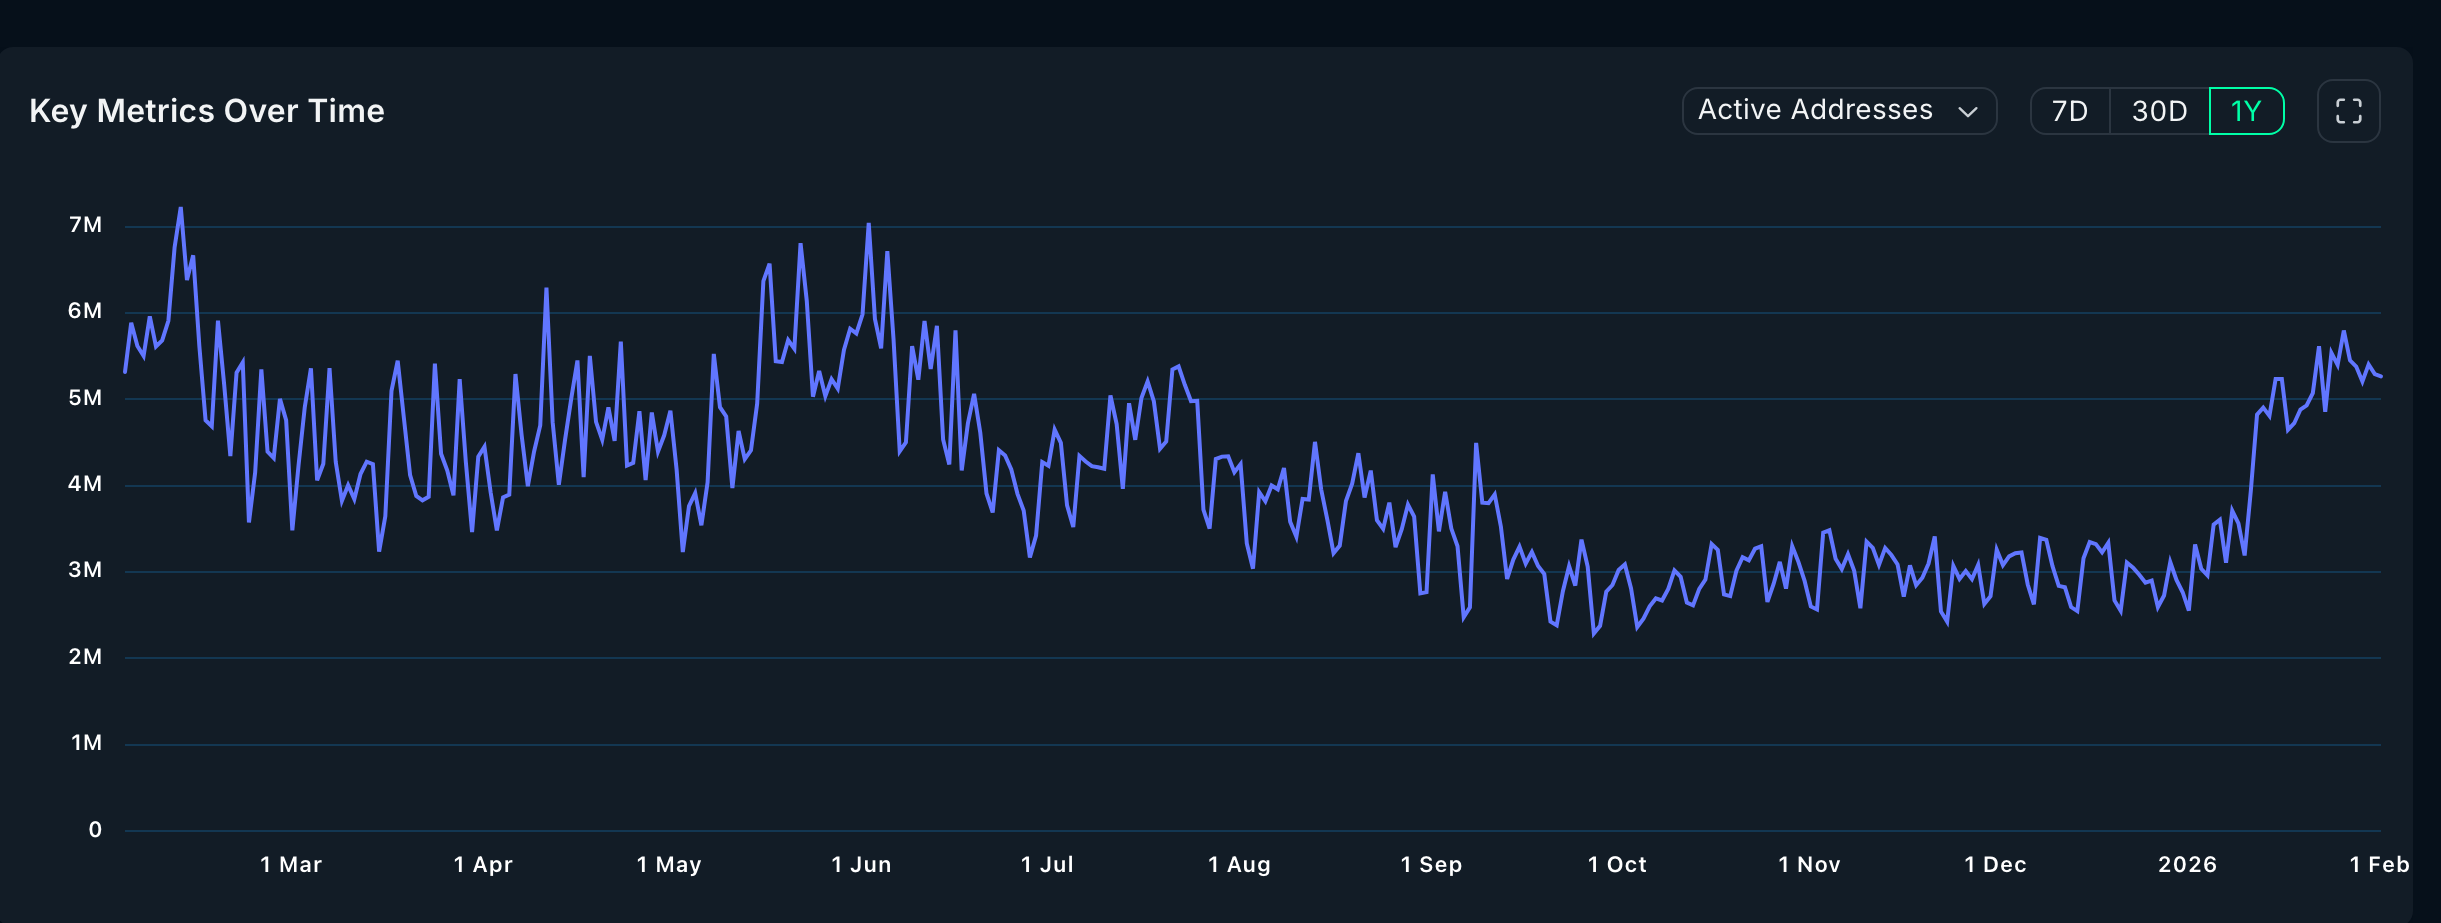
On the positive side, third-party data shows that Solana’s network is firing on all cylinders. According to Nansen, the number of active addresses soared by 72% in the last 30 days to over 100 million.
These numbers make it the most active network in the crypto industry. For example, Ethereum handled over 14.9 million active addresses, while BNB Chain had over 40 million in the same period.
The same is happening in terms of the rising number of transactions. It handled over 2.3 billion, up by 36% in the last 30 days. As a result, the fees the network generated jumped to over $26 million, twice what Ethereum network made.
Additionally, Solana’s ETFs continued adding assets in January, even as Ethereum and Bitcoin shed assets. These funds added over $104 million in assets in January, compared with Bitcoin’s $1.6 billion in January. Ethereum ETFs shed over $353 million. That is a sign of strong analyst demand for the coin.



