
 Walrus
 Bitcoin
 Quantus
 Pearl
Pearl Quant
Quant Pudgy Penguins
 Sui
Sui

Bitcoin’s price has surged back above $70,000 after a softer-than-expected U.S. inflation report alleviated concerns. The rebound lifted broader crypto sentiment with investors watching key technical levels. At the same time, a Brazilian proposal for a large Bitcoin reserve is adding a new adoption narrative.
Bitcoin Price Bounce After Bear Flag Target at $62K
One widely shared chart from Trader Tardigrade revealed a weekly bear flag breakdown targeting $62,000. The analyst emphasized that Bitcoin price followed the pattern quite well and reached that target zone. He also suggests that the move completed the bearish leg and set the conditions for a reversal.
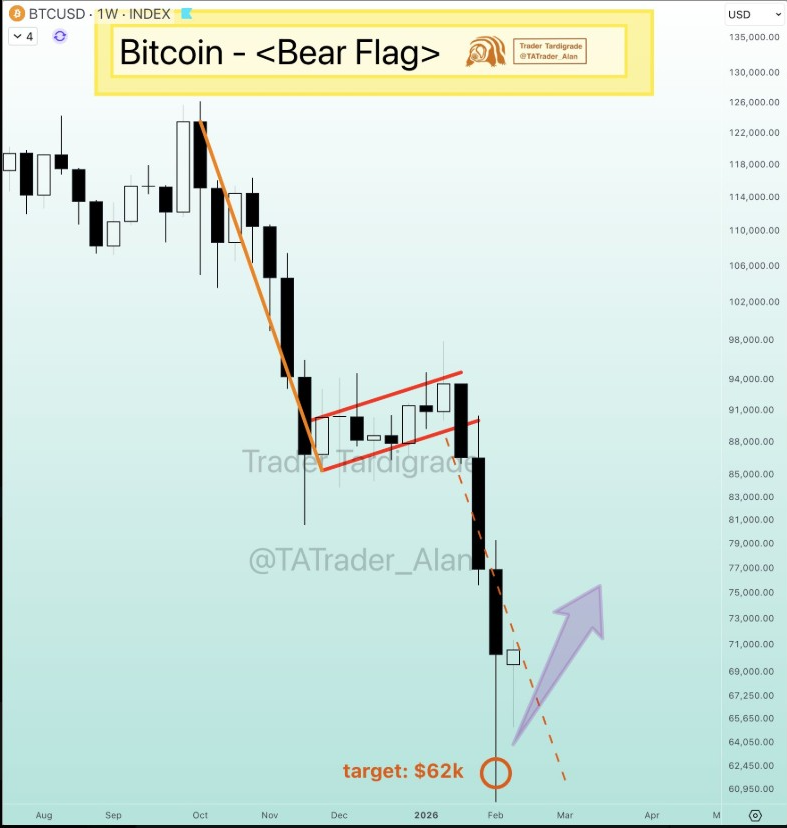
The chart showed the sharp decline from the flag structure to the $62K area. It then points to a potential shift in trend, with an upward arrow indicating a bounce. In this framing, the major job now is to hold low and build higher closes.
Price action also reflects a classic “capitulation then response” sequence. Large red candles were followed by a stabilization candle close to the target. This pattern often will encourage dip buying; however, confirmation needs follow-through.
Traders will still keep an eye out as to whether $62K becomes a durable floor. Any breakdown below that zone would weaken the completed-flag thesis. For now, the story in the chart is a rebound attempt from the completed target.
Macro Catalyst Pushes BTC Price Back Toward Key Levels
Furthermore, Bitcoin price strength has been supported by improving risk appetite after the inflation data surprise. That report helped put immediate fears of tighter financial conditions in the rear. In turn, buyers returned across major tokens, boosting market sentiment.
Market snapshots indicate Bitcoin is hovering around $70,000 once again after the bounce. In the same window, the broader cryptocurrency market also moved higher, in line with renewed demand. Ether recovered in the $2,000 area, while XRP made gains on the day.
This recovery is important as it brings the focus back to the resistance levels. In many cycles, a sharp sell-off is followed by a relief rally. The rally then faces its true test at the regain of support zones.
Ali Charts added another technical frame of reference using a comparative frame. He suggested Bitcoin could be replicating an S&P 500 recovery structure. In his opinion, recovering the $75,000 as support would enhance that scenario.
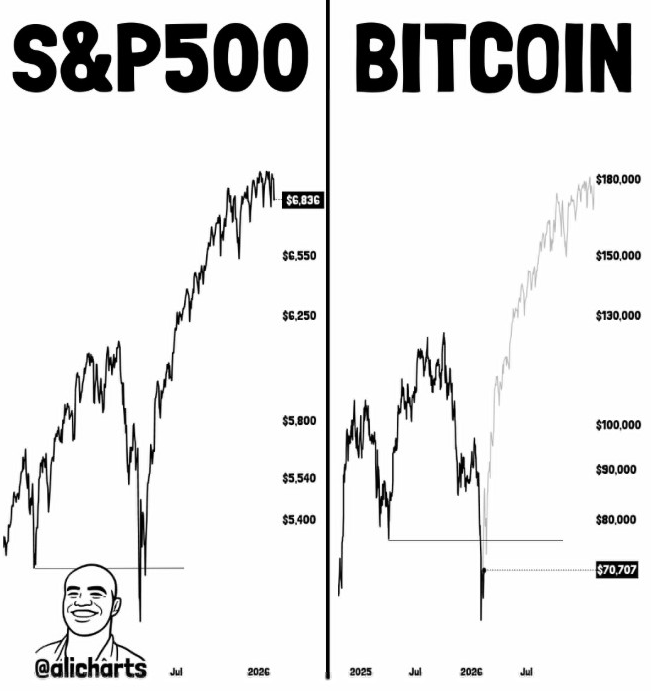
That $75K Zone now serves as a confidence zone for bulls. A clean reclaim could bring in more momentum buyers. Failure to reclaim could keep the market choppy and defensive.
Brazil’s Reserve Proposal Adds a New Bitcoin Price Story
Brazil is also fueling the conversation with a proposed strategic Bitcoin reserve bill. The proposal would aim to buy a million Bitcoin over five years. The plan is described as gradual to minimize market disruption.
If done, the scale would be important for a sovereign buyer. Supporters say it could diversify national reserves and enhance long-term positioning. The bill also includes ideas to increase everyday Bitcoin integration.
Reported incentives include the possibility of paying federal taxes and fines in Bitcoin. The proposal also calls for a reduction in taxation on crypto sales. Another provision would keep the confiscated Bitcoin in the reserve, rather than selling it.
The proposal remains under review by key congressional committees. It must pass review through the economic development, finance, and justice channels. That process may take some time and may alter final terms.
Even so, the headline by itself can have a sentimental impact. Narratives are traded in markets before policy is enacted into law. That dynamic can lift Bitcoin price expectations during sensitive technical periods.
Bull Trap Talk Meets a $170K Roadmap and $75K Gate
Another shared by Klarck’s charts the recent move as a “bear trap” about to be completed. The comparison is used with the past cycle structures and brings up a potential breakout pathway. In that framing, Bitcoin is in a shakeout with a renewed bull run on the way.
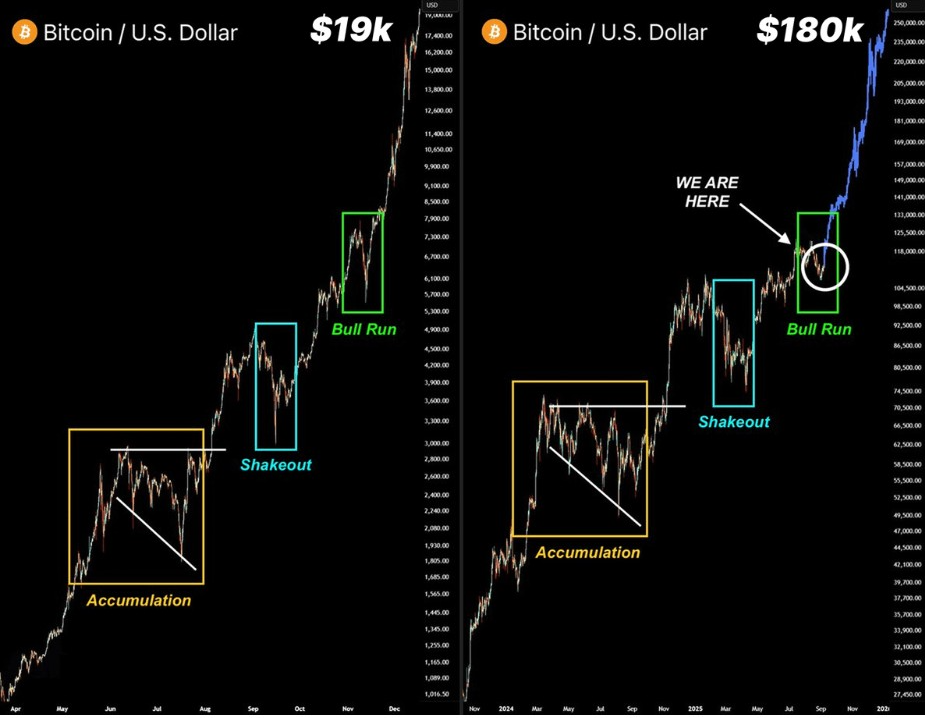
Klarck’s reference charts indicate accumulation first, followed by a shakeout. They then exhibit an advance into a powerful trend expansion. He suggests a similar setup could support a much higher upside phase.
However, these long-range targets first depend on near-term confirmation. The market has to stabilize after the sharp descent. It also needs to reclaim major levels that alter the market structure.


