
 Pearl
Pearl Walrus
 Starknet
 Quantus
 Bitway
 Sui
Sui Zylo Ecosystem

Ethereum price is trading near a key support level. There, liquidity clusters squeeze price movements between $1,900 and $2,300. Analysts noted persistent rejection at $2,200 and repeated reactions at $1,950.
ETH’s present price structure indicates a balance between supply pressure and concentrated bid zones. Moreover, market indications are that trends are driven by liquidity-based movement in most of the recent sessions.
Range Pressure Builds on Ethereum Price Structure
Analyst BrutalBTC says ETH price is in a horizontal range that developed following an extended decline. Price continues to head in both directions between support and supply resistance of $1,950 and $2,300, respectively.
Both rallies to the mid-range moving average cannot hold. These recurring losses strengthen a seller-dominated pattern in the greater bearish pattern.
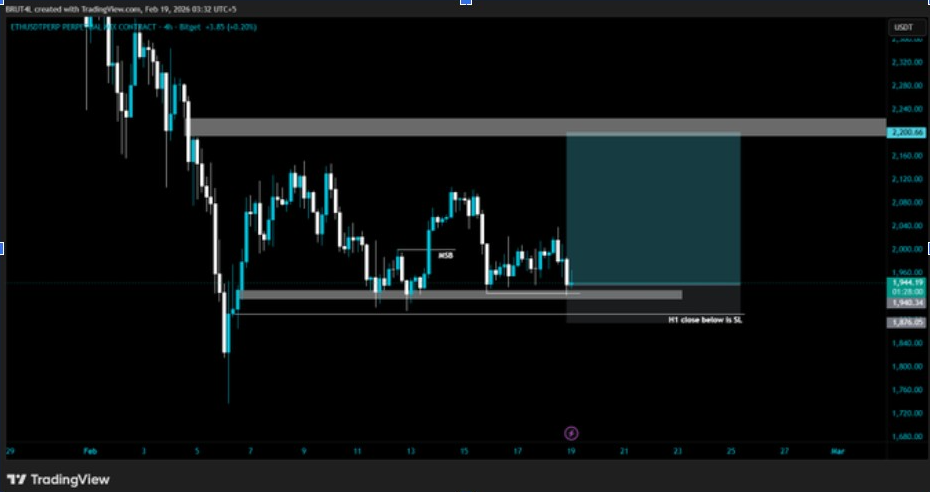
Also, recent candles demonstrate that ETH price is moving directly to the bottom of the range. The analyst noted a breakdown trigger in case of confirmed lower timeframe closes below $1,900.
Such support levels tend to accumulate liquidity under repeated reactions. Clustered stop orders can accelerate downside shifts once violated to a deeper demand zone.
On a structural perspective, the price has produced lower highs across the range formation. This pattern suggests distribution.
At the same time, compression toward horizontal support increases breakdown probability. According to the chart, a loss of $1,950 could expose the next demand zone near $1,850 for the asset.
Meanwhile, invalidation of the short-bias scenario remains clearly defined on the chart. A sustained move above $2,300 would shift the structure toward accumulation. Conversely, acceptance above that band would challenge the prevailing bearish context.
Liquidity Clusters Direct ETH Price Movement
Analyst CW suggests that the Ethereum price is locked in dense order clusters at the moment. Sell walls continuously appear at $2,100. Strong bids hold firm at $1,950.
Price also fluctuates between these zones without any directional dominance. Such a situation is an indicator of a market that is waiting to have its liquidity balanced.
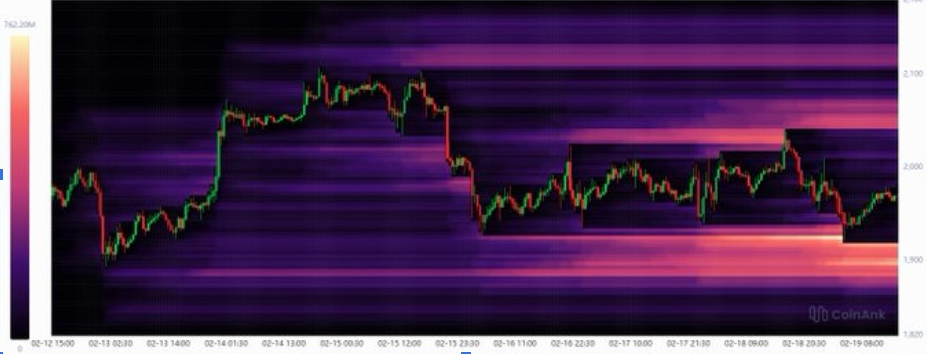
The abrupt drop in the middle of the chart shows ETH moving quickly through a low-liquidity zone. This sharp move highlights how thin order books can amplify price swings. When the price had hit a congested bid zone around $1,950, it stabilized.
Thin order levels indicate expansion of momentum with such movement. Further consolidation implies absorption of orders by bigger players who defend support zones.
Beyond the prevailing price, thick sell-side liquidity remains in place that puts a limit on recovery efforts. Each move is met by resting offers, which are active resistance.
According to liquidity models, price tends to move between concentrated order zones. Hence, the upper limit acceptance above $2,100 would result in a new cluster being higher.
Conversely, a loss of the bid zone could lead to lower levels of liquidity. The chart indicates that a shortfall of $1,900 could come about in case of weak support.
ETH price, consequently, is still between rival liquidity concentrations, and expansion of volatility relies on the cluster being weakened.
Inflow Data Signals Macro Ethereum Price Accumulation
Analyst CryptoJack emphasizes that Ethereum price divergence relative to exchange inflows signals macro accumulation. He argues that this pattern reflects strong buying interest despite short-term market pressures.
Multi-year data indicate an increase in volume of inflows at a price lower than in previous cycles. The chart indicates that record inflows spurred within the price range of $2,000-$4,000. This trend is historically associated with early accumulation stages.
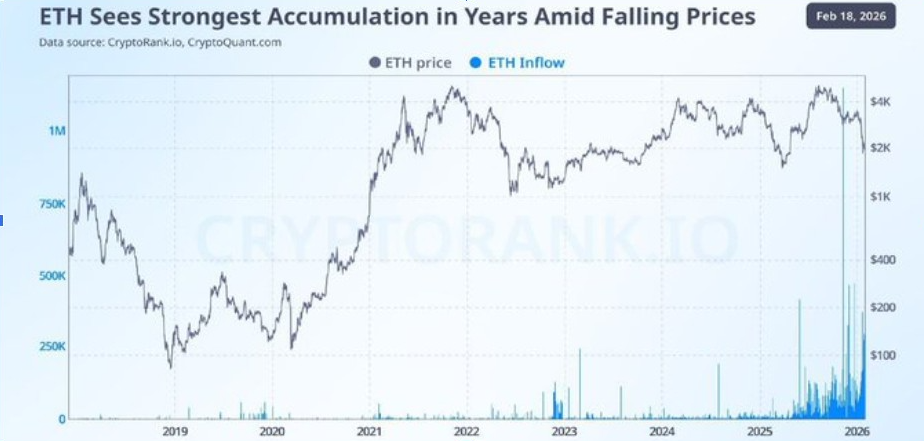
Further, previous cycles show comparable expansions of inflows around structural depressions. Similar spikes in 2020 were followed by significant recovery periods.
The existing inflow power is witnessed, and the asset consolidation is observed below the 2021 peak. This divergence points out that capital is venturing into the market even though the price is performing dismally.
Besides, sustained inflows imply long-term positioning. Increased capital involvement amid weakening prices indicates strategic accumulation behavior. Previously, inflows during consolidation preceded a decrease in supply conditions.
The chart highlights the current phase as accumulation within a broader cycle. Price volatility persists even as inflow metrics strengthen.
Structural demand trends have expanded across recent years. However, the Ethereum price remains positioned within a capital growth environment.



