
 Pearl
Pearl NEAR Protocol
 Bitway
 Starknet
 Walrus
 Pudgy Penguins
 Hyperliquid

Ethereum (ETH) price is trading near a critical stabilization band after a sharp breakdown from the $3,000 zone. Price recently compressed inside the $1,750–$1,900 demand zone following heavy sell pressure. Analysts identified layered resistance above $2,070 and deeper liquidity below $1,750. Ethereum price now approaches a technical crossroads where the reaction to support will determine the short-term structure.
Ethereum Price Tests Layered Demand After Breakdown
According to analyst Ted Pillows, Ethereum decisively lost multiple support shelves during the decline. ETH price had a strong momentum below $2,400, indicating aggressive sell-side dominance.
Currently, the price is stabilized within a tight demand band between $1,750 and $1,900. This zone previously supported expansion during earlier market phases. A small compression pattern has formed following the decline. Analysts interpret this structure as a potential bear flag.
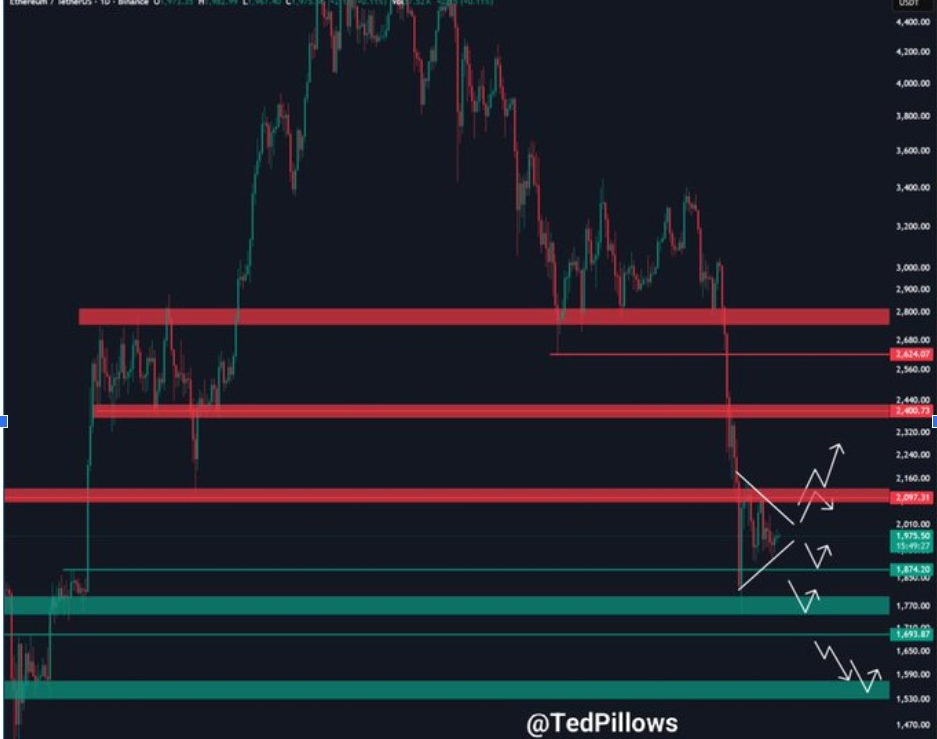
Meanwhile, resistance layers above price remain structurally significant. The $2,150 zone acts as the primary reclaim threshold. Acceptance above that band could trigger short covering. A relief rebound toward $2,400 would then become technically feasible.
Nevertheless, a loss of previous support leaves bearish structural conditions unchanged. In the case of a break of the $1,750 shelf, liquidity levels stretch to $1, 450. These zones coincide with historical consolidation. Hence, Ethereum price is under the control of demand stability in the current band.
Fibonacci Levels Define Ethereum Price Reaction Zone
On the other hand, analyst Cantonese highlighted that Ethereum price now interacts with major Fibonacci retracement levels. The downward trend aligned the price towards the 0.5 retracement near $1,900. This midpoint serves as a decision level in trending markets. The trend of reaction here is what decides a continuation or an additional correction.
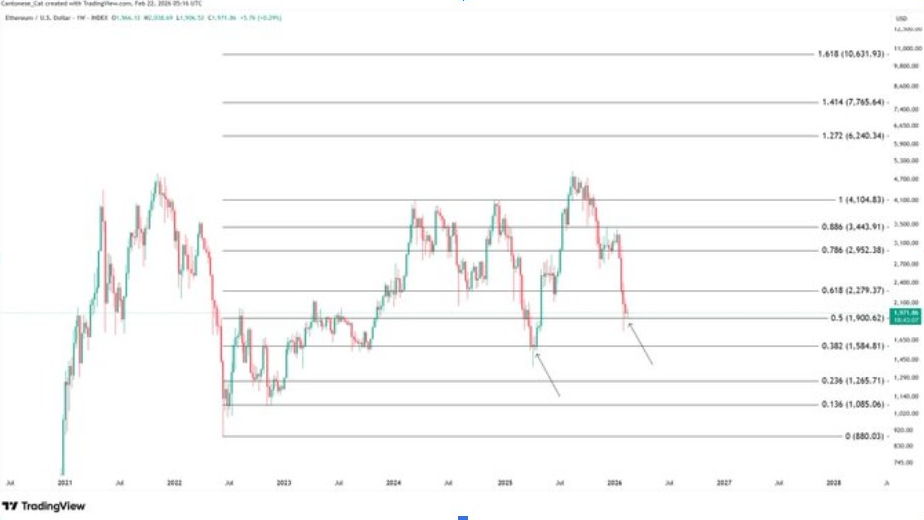
Below the midpoint, Fibonacci confluence intensifies across several retracement levels. The 0.618 retracement appears near $1,780. The 0.786 level forms additional support near $1,600. Together, these create a high-probability reaction cluster.
In addition, the previous market cycles recorded corrective movements that ended in this retracement band. Shifts toward these zones indicate momentum exhaustion and not a trend collapse. The bad stabilizing could point to the completion of a corrective structure. This would be in line with the classical cycle retracement dynamics.
However, a prolonged acceptance below the 0.786-0.886 range may nullify the retracement model. This exposes Ethereum further to structural resetting.
Capitulation Reset Shapes ETH Price Structure
According to analyst Chad’s chart, Ethereum recently experienced a capitulation flush. Such actions reduce leverage and reset market sentiment. However, price remains below intersecting macro resistance lines.
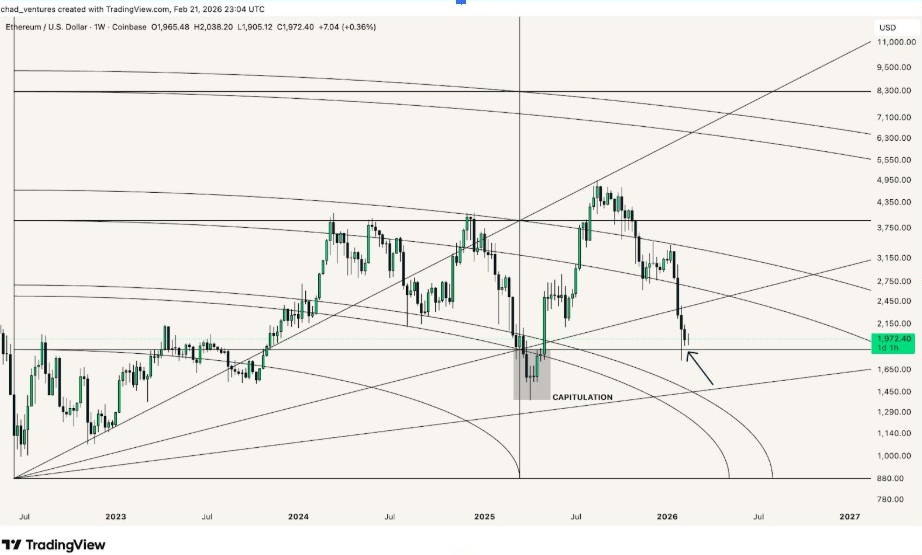
In addition, multiple diagonal resistance structures converge between $2,300 and $3,000. These trend lines represent long-term supply ceilings within the macro cycle. More so, recovery attempts may face pressure within this resistance cluster. Structural rebuilding requires sustained acceptance above these converging barriers.
Moreover, the macro chart highlights curved trend arcs that indicate the direction of the long-term market trend. Ethereum is trading below these structural curves at the moment. Such positioning is transitional rather than a reversal. ETH price must reclaim broken support lines to shift structural bias.
Contrastingly, deeper macro support could be exposed by the inability to maintain capitulation lows. Long-term arcs are oriented towards the $1,500 zone. These zones used to be key structural focal points. The Ethereum price is currently between a recovery resistance and a lower-cycle support in the wider market.




