
 Pearl
Pearl Zylo Ecosystem
 Bitway
 Derive
 Walrus
 Quantus
 Pudgy Penguins

Ethereum (ETH) price trades in the lower zone of the macro structure after reacting to support near $1,894. The altcoin price is still within long term trend limits visible across analytical structures. The cyclical trend is reflected in the market structure. Analysts point out signs aligning in favor of a structured Ethereum price prediction.
Ethereum Price Prediction Signals Channel Support
Analyst Trader Tardigrade suggested that Ethereum is in a macro rising channel as seen on the weekly structure. The setup relates significant swing highs and lows across cycles. Price peaks of around $4,055 and $4,833 formed near the upper channel. At the same time, local bottoms were formed at structural support around $1,565.
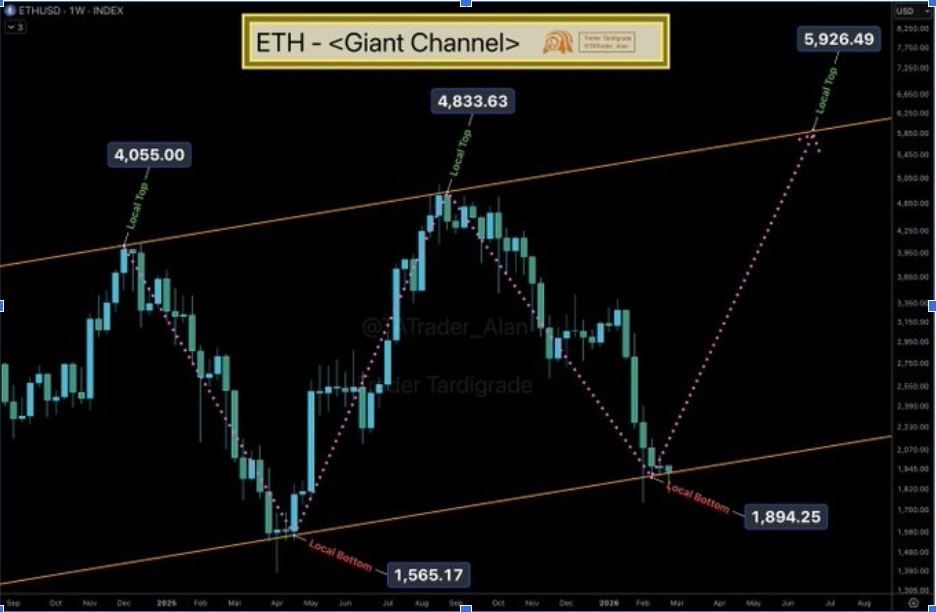
The trend shows cyclic motion between strength and weakness instead of unpredictable volatility. Every dip to the lower boundary produced a strong directional recovery. The recent reaction around $1,894 is in line with the previous accumulation zones. This measure is in favor of structured Ethereum price prediction based on channel symmetry.
Additionally, the projected trend demonstrates possible movement to the upper limit close to the $5,900 level. The target is an indicator of historical patterns of reaction after support tests. The channel slope suggests continuation and not exponential expansion in the trend. Structural integrity is preserved as the price respects the lower limit.
Moreover, repeated cyclic symmetry enhances the macro interpretation of the trend persistence. The asset remains in a specified directional path near support, which implies structural preservation.
Harmonic Structure Expands Ethereum Price Prediction
Meanwhile, Crypto Spaces showed a widening wedge pattern that characterized rising price movements. Price has been moving back and forth between the 0.86 Fibonacci retracement zone and the X, A, B, C, and projected D sequential points. This is a zone that signifies the accomplishment of a remedial stage in the structure.
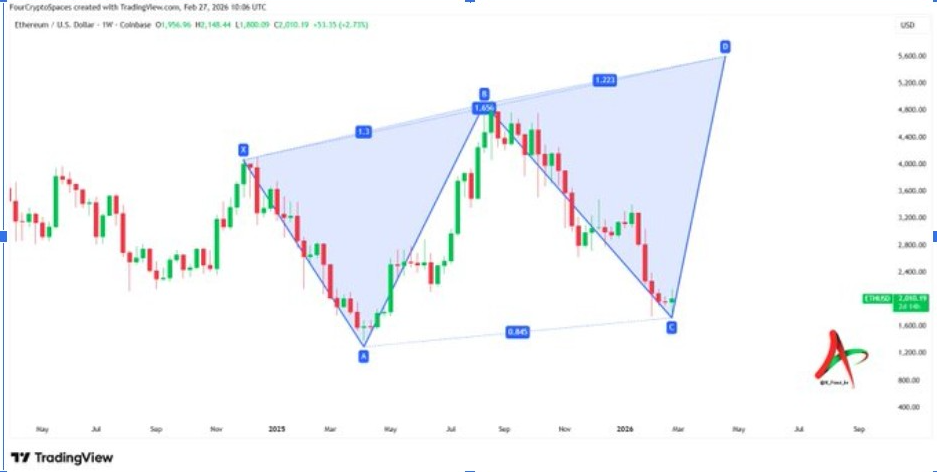
The estimated growth aims at the upper boundary close to $5,400. This zone coincides with the expanding volatility profile of the formation. Expansion is indicated by an increasing amplitude between swings. The setup favors the bullish Ethereum price prediction continuation model.
Notably, past swing movements observed Fibonacci relations throughout the formation. If the price rebounds from the bottom, it would suggest that demand is absorbed at structural support. ETH price remains within an expansion framework. The analysis interprets the corrective move as a structural rotation.
Furthermore, the projected path between points C and D represents re-entry of momentum after retracement. The trend places the current condition in a larger growth cycle. This setup supports directional continuity in an expanding market system. The crypto asset is in parallel with expansion behavior.
Cycle Timing Supports Ethereum Price Prediction
Analyst Crypto Caesar suggested that Ethereum price is subject to repeated cyclical patterns present on the weekly charts. Vertical lines show regular repetitions between significant turning points. Every period is associated with exhaustion of momentum and a change of direction. The existing position aligns with previous cyclical bottoms.
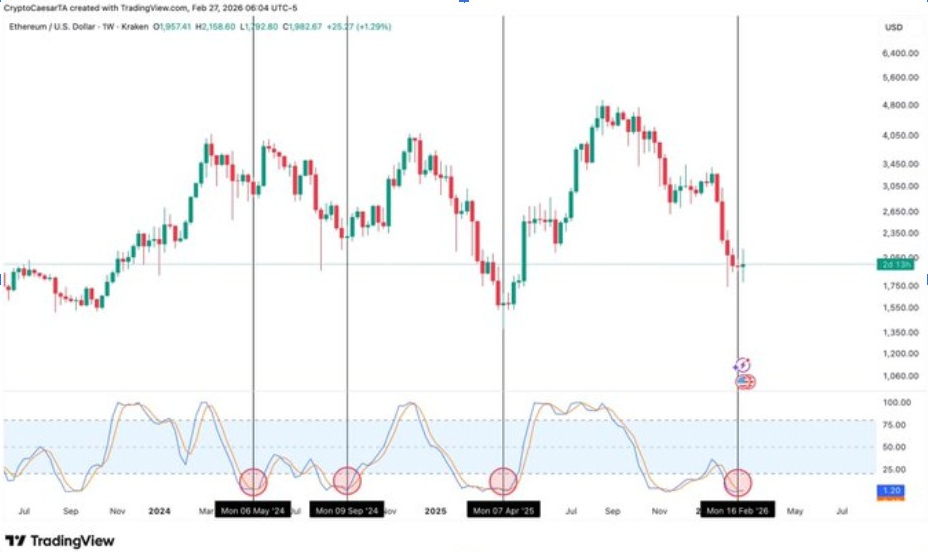
The stochastic oscillator has taken a turn towards historically oversold zones across previous macro troughs. Past cycles also indicate comparable momentum squashing before periods of continuous upward movement. The indicator shows momentum reset and not structural degeneration. The action helps point to a cyclical-based Ethereum price prediction model.
Additionally, historical rhythm shows declines following overbought momentum and recoveries following deep compression. The current oscillator position mirrors prior transition periods. Time symmetry across cycles reinforces structural continuity. Price movement appears synchronized with the recurring market rhythm.
Moreover, the chart focuses on time consistency instead of single price indicators. Regular distribution of cycle lows implies orderly behavior in the market. The current circumstances are included in Ethereum price cycle history.



