
 astronaut
 Zylo Ecosystem
 Pearl
Pearl Quantus
 Bitcoin
 Sui
Sui Bitway

Ethereum has moved into a more fragile part of its recent structure after slipping below the $2,000 support zone. Recent charts focus on the nearest $1,900 zone, which analysts consider the next potential downside level. Although there still are chances of short-term rebound efforts, the bigger picture indicates that the market is seeking a strong foundation. In that regard, Ethereum price prediction will depend on how buyers defend the next support band before the pressure escalates.
Ethereum Price Prediction Turns Bearish Below $2,000
According to Crypto Tony, Ethereum remains under short-term pressure after a sharp rejection from recent highs. The chart shows ETH falling quickly and then pausing near the lower end of the visible range. That pause does not yet look like a durable bottom. Instead, the projected path suggests the ETH price may attempt a small rebound before another leg lower develops.
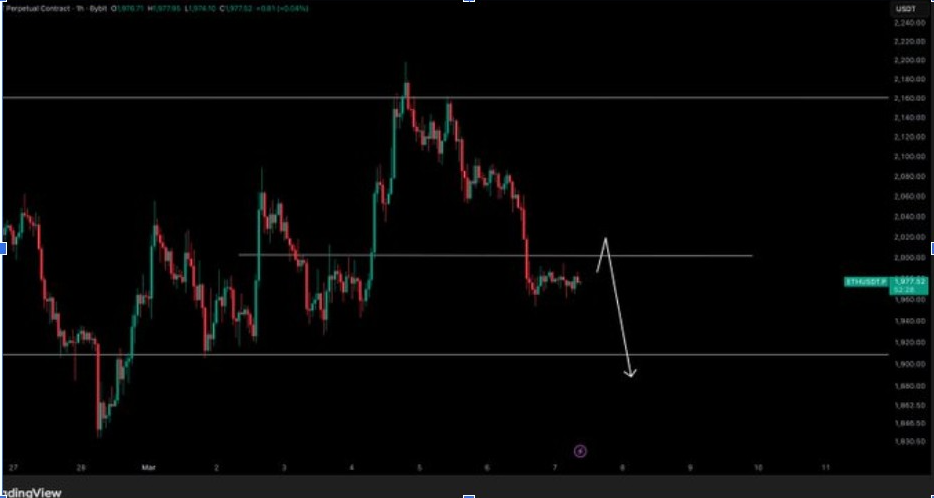
The structure on the chart suggests a weak market stabilizing after losing momentum. Price failed to hold higher levels and then dropped into a lower range zone. In technical terms, that often points to stronger sellers or fading demand. For Ethereum’s price prediction, the current pause is important, but it is not yet considered a reliable support floor.
Moreover, the projected path on the chart shows a modest move upward before a renewed decline. Such a setup indicates a relief bounce rather than a complete turnaround. These rebounds are usually monitored by short-term traders following sharp pullbacks. But when the bounce stops short of resistance, the market can soon print another lower high and resume its downtrend.
From a technical perspective, the setup remains vulnerable unless Ethereum reclaims nearby resistance and holds above it. Without that recovery, the bearish path remains more relevant. In the meantime, the Ethereum price continues to trade in a weaker short-term structure. That keeps downside levels in view as the market searches for stronger support.
Daily Chart Shifts Focus to $1,900 Zone
Ted’s daily chart emphasizes Ethereum’s loss of the $2,000 support zone. That level had acted as both a psychological marker and a structural floor. Once it broke, the market moved into a different technical phase. The latest Ethereum price prediction from this chart now centers on the $1,850-$1,900 range.
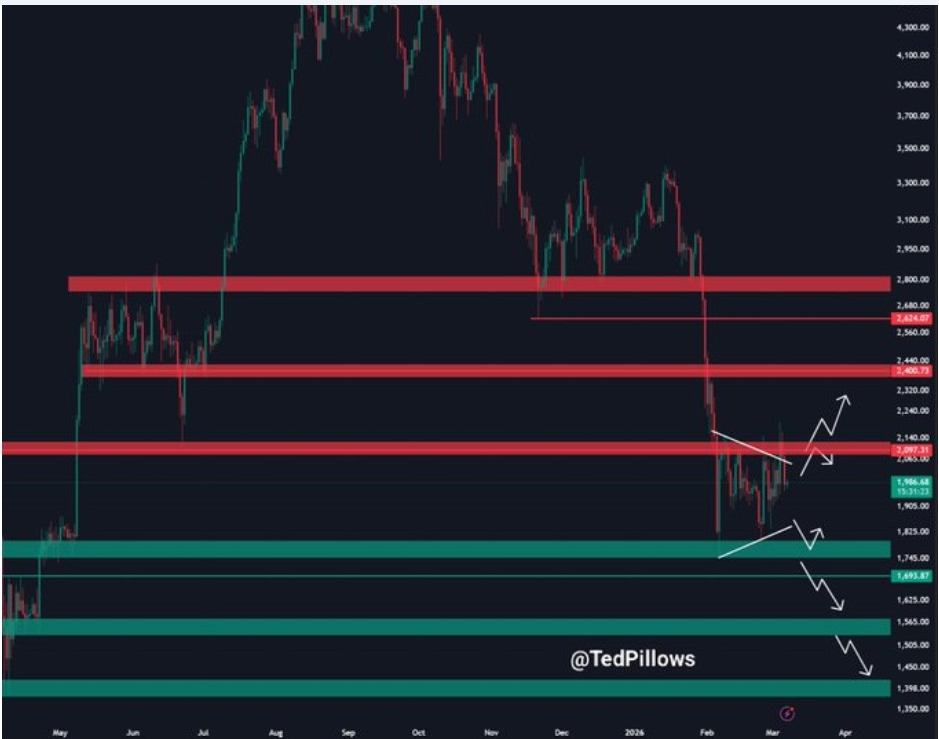
According to the chart, the breakdown did not happen in isolation. Ethereum had already been moving lower before breaking down, which made the trend clearly bearish. Former support levels above the current price are now marked as resistance. That means rallies back into those zones may attract sellers unless the market can reclaim them decisively.
Additionally, Ted’s chart maps two possible paths from the next support region. The first shows Ethereum holding the $1,850 zone and then bouncing higher. This makes the support band a clear technical battleground in the present Ethereum price prediction.
Ethereum Price Faces Bigger Test at Major Support
Whale Factor’s chart reinforces the same bearish structure but adds more emphasis to the downside risk. Like Ted’s chart, it starts with the loss of the $2,000 support zone. From there, the chart identifies Major Support 1 around $1,850 and a second lower support tier beneath it. That makes Ethereum price prediction highly dependent on how the first major zone performs.
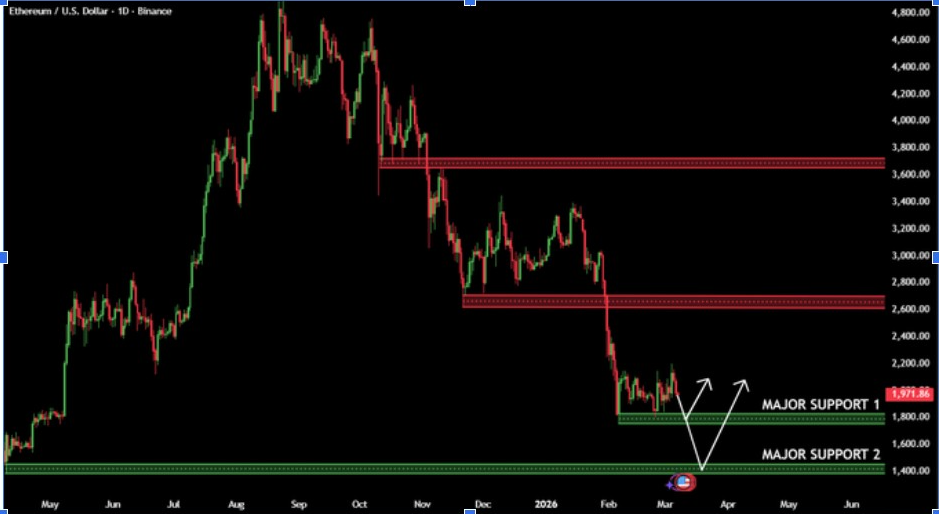
The current formation shows Ethereum‘s price consolidating after a sharp downward trend. The current levels can also support a short-term bounce. Nevertheless, the concern is what will happen if the rebound fails. When that happens, the price would tend to revert to Major Support 1, where buyers would have to act more decisively.
Furthermore, the chart presents downsides as conditional rather than automatic. It does not suggest Ethereum must collapse from here. Instead, it shows a sequence of support tests, with risk increasing if each level fails. That distinction matters because it separates a normal correction from a more serious structural breakdown in the ETH price.




