
 Bitcoin
 NEAR Protocol
 Pudgy Penguins
 Puffer
 ZKsync
 Bitway
 Pearl
Pearl

Dogecoin price is sitting near a critical support zone after another stretch of weak trading. Several chart analysts now recognize compression, retest risk, and a potential cycle base forming. Together, those signals put the next Dogecoin price move under closer watch.
Dogecoin Price Holds Compressed Zone Near Support
Dogecoin price is trading within a tight structure as volatility continues to contract. One chart from Ali Charts showed DOGE consolidating in a triangle on a 4-hour timeframe. The pattern has a price between falling resistance and a flat support band close to the recent lows.
That setup is important because compression often precedes a stronger directional move. In the view of Ali Charts, the triangle could be followed by a 37% move from the current range. However, the chart does not confirm direction. It only revealed that Dogecoin price is nearing a decisive point.
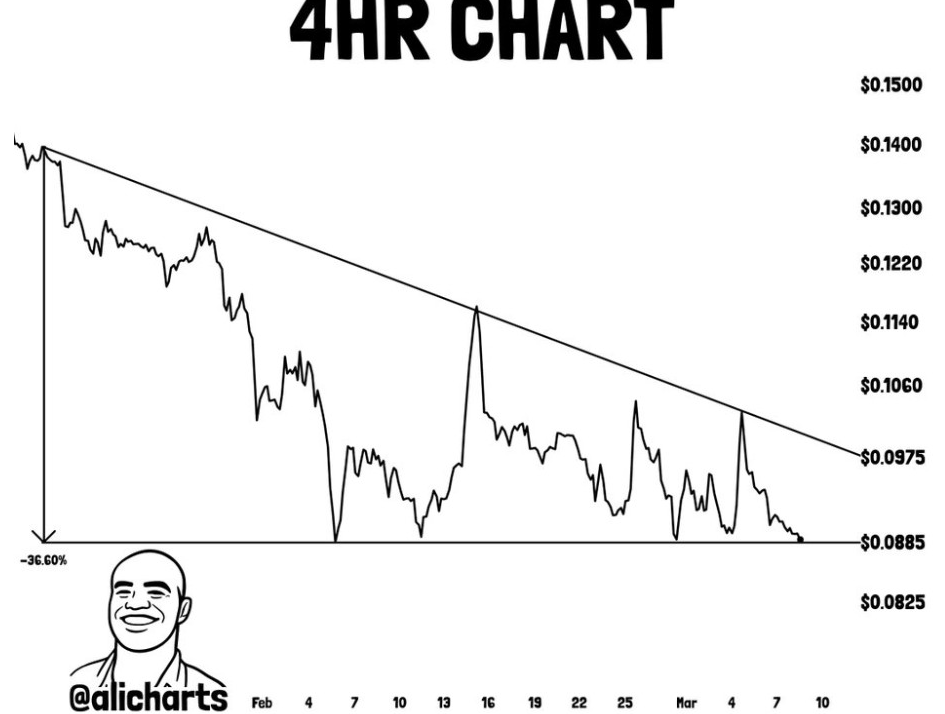
The descending trendline has capped rebounds through February and early March. At the same time, the horizontal base around the $0.0885 has continued to absorb selling. As a result, the structure indicates a market losing range as pressure builds near support.
Symmetrical Triangle Keeps the DOGE Breakdown Debate Open
However, a separate chart from Trader Tardigrade added a more cautious angle. On the daily timeframe, the analyst shows Dogecoin price inside an indecisive symmetrical triangle. That pattern differs from the 4-hour setup but leads to a similar conclusion. DOGE is very close to a decision point.
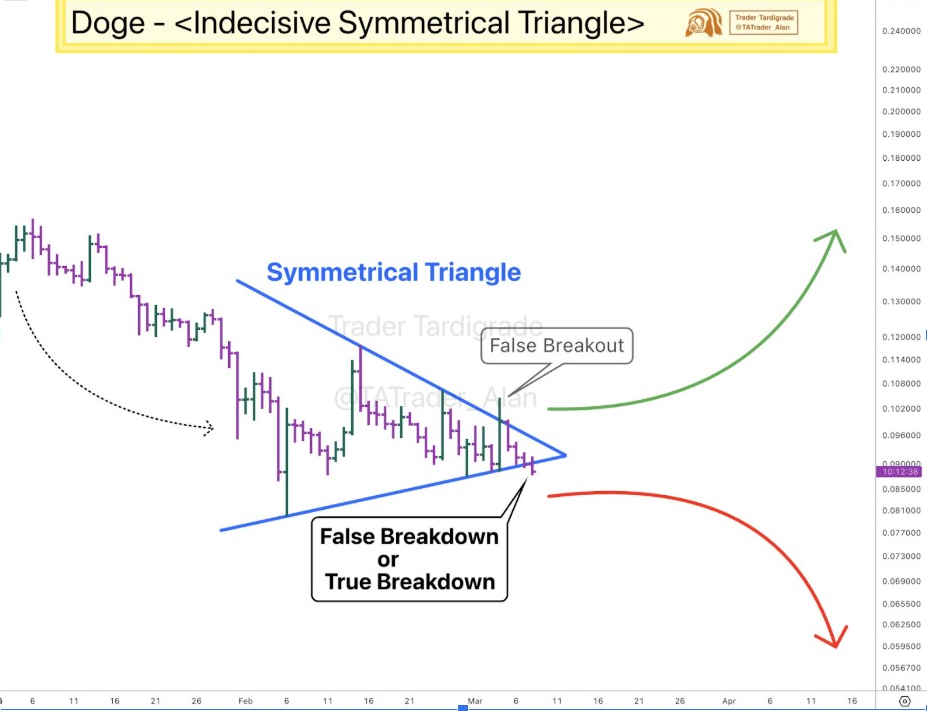
The daily chart showed price pressing towards the lower side of the structure. Trader Tardigrade puts the move in terms of it being a possible false breakdown or a true breakdown. That distinction is important because the chart leaves open the possibility of two very different outcomes in the same area.
In the bullish case, a false break below support could trap late sellers and reverse sharply upward. The projected recovery path leads to a better recovery if buyers rescue the structure. In a bearish case, failure to recover the lower boundary may bring the price towards a deeper decline.
Repeating Mini Cycles Suggest Base May Be Forming
Bitcoinsensus brings a broader market-cycle perspective to the current setup. Its chart makes the argument that Dogecoin has gone in smaller repeating phases throughout the bull market. Those phases are called accumulation, markup, pullback, and repeat. The newest one is currently being considered a potential third accumulation zone.
The chart identified earlier accumulation ranges preceding strong upward expansion. One move yielded about 190%, another grew 480% or so before reaching a peak. The current range, marked as “Accumulation 3?”, is much broader and follows a long decline from the last major peak.
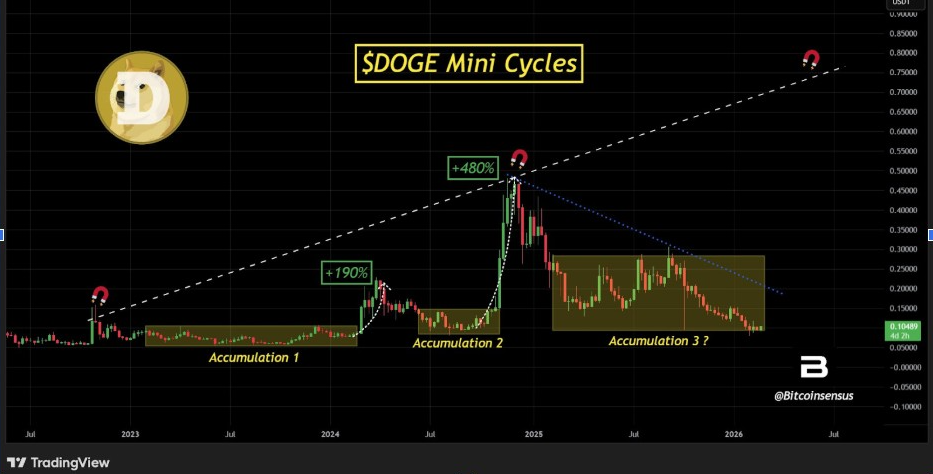
That pattern is important as it puts the recent weakness in a longer cycle context. Instead of considering the current range as mere drift, the chart indicates the market may be building another base. Even so, the analyst does not offer that outcome as certain.
Market Cap Retest Shows Buyers Responding at a Familiar Floor
Furthermore, Trader Tardigrade added another signal using Dogecoin’s market cap chart on the 12-hour timeframe. That chart showed DOGE market value revisiting the February 6 lows of near $13.5 billion. After touching that zone, the market cap bounced sharply, which the analyst reads as a sign of buyer demand.
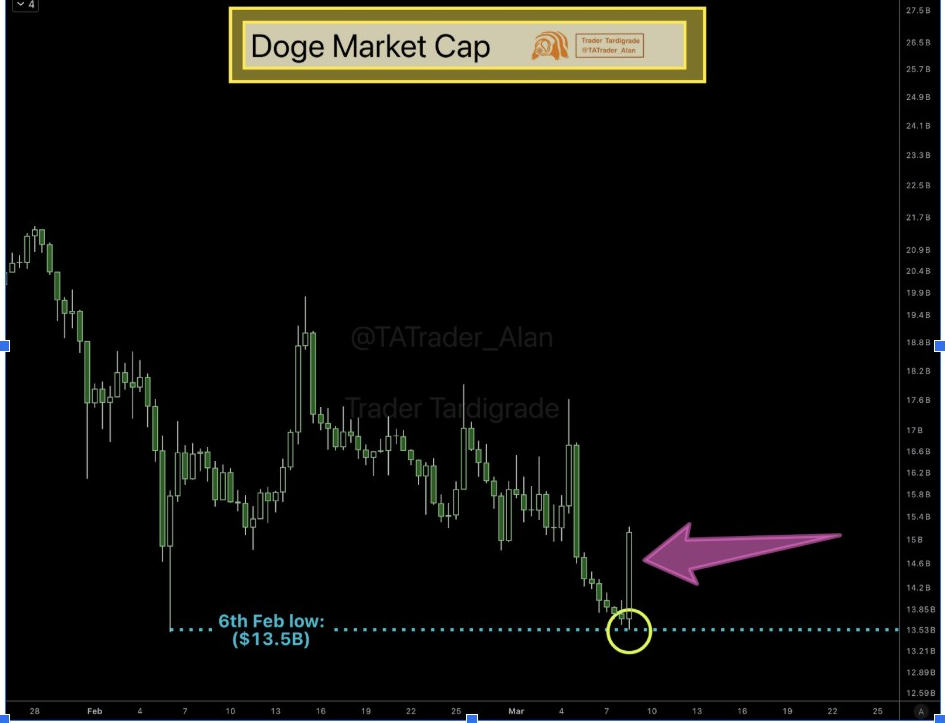
This retest is important because market-cap support can signal greater participation, not just price action on a single chart. In this case, the bounce came about exactly where the prior low had already marked an important floor. As a result, the reaction supports that the buyers are still defending this area.
That signal also connects to the triangle structures. While there are clear signs of indecision in the price patterns, the market cap chart suggests that demand has not gone away. Instead, buyers are active at a known support zone. Therefore, Dogecoin price is now between repetitive support response and unresolved breakdown pressure.


